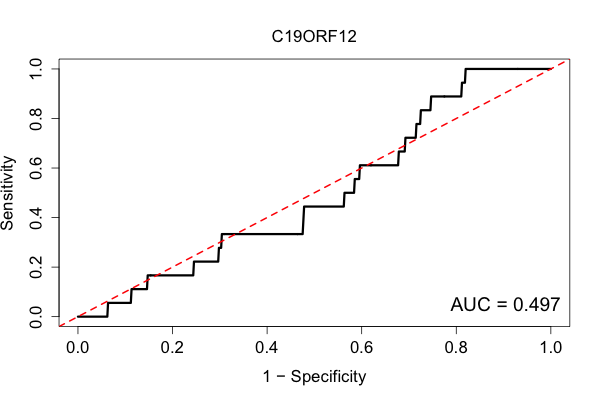
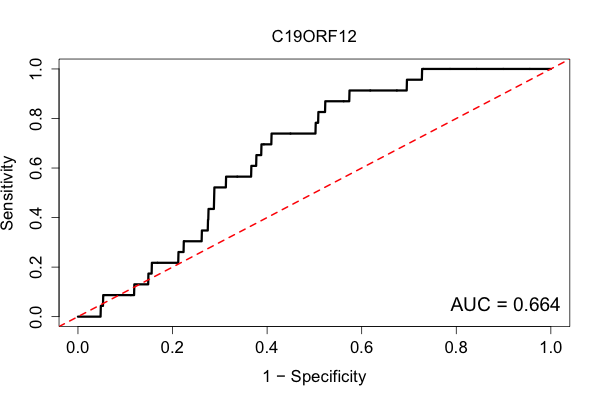
| Rank | Gene Set | Z-score |
|---|---|---|
| 1 | regulation of sequestering of triglyceride (GO:0010889) | 4.53301070 |
| 2 | low-density lipoprotein particle clearance (GO:0034383) | 4.16337100 |
| 3 | triglyceride catabolic process (GO:0019433) | 3.98269766 |
| 4 | pyrimidine nucleobase catabolic process (GO:0006208) | 3.68799136 |
| 5 | acylglycerol catabolic process (GO:0046464) | 3.63295959 |
| 6 | neutral lipid catabolic process (GO:0046461) | 3.63295959 |
| 7 | ethanol oxidation (GO:0006069) | 3.43080352 |
| 8 | glyoxylate metabolic process (GO:0046487) | 3.39437878 |
| 9 | response to dietary excess (GO:0002021) | 3.33665714 |
| 10 | glycerolipid catabolic process (GO:0046503) | 3.09384741 |
| 11 | brown fat cell differentiation (GO:0050873) | 3.04526245 |
| 12 | alanine transport (GO:0032328) | 3.01226688 |
| 13 | membrane depolarization during cardiac muscle cell action potential (GO:0086012) | 2.99027072 |
| 14 | regulation of synapse structural plasticity (GO:0051823) | 2.98914698 |
| 15 | regulation of glycogen (starch) synthase activity (GO:2000465) | 2.97655495 |
| 16 | plasma lipoprotein particle clearance (GO:0034381) | 2.96182975 |
| 17 | acylglycerol homeostasis (GO:0055090) | 2.93432837 |
| 18 | triglyceride homeostasis (GO:0070328) | 2.93432837 |
| 19 | L-phenylalanine catabolic process (GO:0006559) | 2.88300219 |
| 20 | erythrose 4-phosphate/phosphoenolpyruvate family amino acid catabolic process (GO:1902222) | 2.88300219 |
| 21 | nucleobase catabolic process (GO:0046113) | 2.81462387 |
| 22 | drug catabolic process (GO:0042737) | 2.79750305 |
| 23 | regulation of triglyceride catabolic process (GO:0010896) | 2.77520668 |
| 24 | phospholipid homeostasis (GO:0055091) | 2.75299806 |
| 25 | regulation of cAMP-dependent protein kinase activity (GO:2000479) | 2.74740279 |
| 26 | positive regulation of lipid storage (GO:0010884) | 2.74535475 |
| 27 | fatty acid homeostasis (GO:0055089) | 2.72814555 |
| 28 | alpha-linolenic acid metabolic process (GO:0036109) | 2.69497865 |
| 29 | synaptic vesicle maturation (GO:0016188) | 2.69415292 |
| 30 | positive regulation of phosphoprotein phosphatase activity (GO:0032516) | 2.68043396 |
| 31 | creatine metabolic process (GO:0006600) | 2.64711603 |
| 32 | fatty acid catabolic process (GO:0009062) | 2.63053194 |
| 33 | exogenous drug catabolic process (GO:0042738) | 2.62945352 |
| 34 | regulation of cholesterol storage (GO:0010885) | 2.61646399 |
| 35 | axonal fasciculation (GO:0007413) | 2.61105697 |
| 36 | peptidyl-glutamic acid carboxylation (GO:0017187) | 2.61027180 |
| 37 | protein carboxylation (GO:0018214) | 2.61027180 |
| 38 | fatty acid beta-oxidation (GO:0006635) | 2.58059025 |
| 39 | dendritic spine morphogenesis (GO:0060997) | 2.57845625 |
| 40 | fatty acid transmembrane transport (GO:1902001) | 2.55583345 |
| 41 | erythrose 4-phosphate/phosphoenolpyruvate family amino acid metabolic process (GO:1902221) | 2.53601313 |
| 42 | L-phenylalanine metabolic process (GO:0006558) | 2.53601313 |
| 43 | synaptic vesicle exocytosis (GO:0016079) | 2.51301563 |
| 44 | diacylglycerol metabolic process (GO:0046339) | 2.50627584 |
| 45 | ethanol metabolic process (GO:0006067) | 2.49751585 |
| 46 | fatty acid beta-oxidation using acyl-CoA oxidase (GO:0033540) | 2.45206429 |
| 47 | positive regulation of glycolytic process (GO:0045821) | 2.43581491 |
| 48 | monocarboxylic acid catabolic process (GO:0072329) | 2.43573951 |
| 49 | negative regulation of metanephros development (GO:0072217) | 2.43490461 |
| 50 | cGMP-mediated signaling (GO:0019934) | 2.41626749 |
| 51 | positive regulation of triglyceride lipase activity (GO:0061365) | 2.41022182 |
| 52 | positive regulation of lipoprotein lipase activity (GO:0051006) | 2.41022182 |
| 53 | triglyceride-rich lipoprotein particle remodeling (GO:0034370) | 2.40348476 |
| 54 | lipid storage (GO:0019915) | 2.39289501 |
| 55 | negative regulation of lipid catabolic process (GO:0050995) | 2.39166264 |
| 56 | regulation of respiratory gaseous exchange by neurological system process (GO:0002087) | 2.35027119 |
| 57 | complement activation, alternative pathway (GO:0006957) | 2.34569411 |
| 58 | cellular response to epinephrine stimulus (GO:0071872) | 2.33791074 |
| 59 | protein heterotrimerization (GO:0070208) | 2.33106329 |
| 60 | serine family amino acid catabolic process (GO:0009071) | 2.33098663 |
| 61 | ketone body metabolic process (GO:1902224) | 2.33060219 |
| 62 | regulation of lipoprotein metabolic process (GO:0050746) | 2.30441087 |
| 63 | acetyl-CoA metabolic process (GO:0006084) | 2.29054853 |
| 64 | regulation of fibrinolysis (GO:0051917) | 2.28873819 |
| 65 | protein localization to synapse (GO:0035418) | 2.27932589 |
| 66 | neurotransmitter-gated ion channel clustering (GO:0072578) | 2.26967959 |
| 67 | negative regulation of mast cell activation (GO:0033004) | 2.24257843 |
| 68 | daunorubicin metabolic process (GO:0044597) | 2.23995053 |
| 69 | polyketide metabolic process (GO:0030638) | 2.23995053 |
| 70 | doxorubicin metabolic process (GO:0044598) | 2.23995053 |
| 71 | cellular ketone body metabolic process (GO:0046950) | 2.23527880 |
| 72 | NADH metabolic process (GO:0006734) | 2.22670575 |
| 73 | primary alcohol catabolic process (GO:0034310) | 2.22441515 |
| 74 | response to phenylpropanoid (GO:0080184) | 2.22311383 |
| 75 | neuron recognition (GO:0008038) | 2.22066548 |
| 76 | positive regulation of fatty acid oxidation (GO:0046321) | 2.21890720 |
| 77 | positive regulation of glycogen biosynthetic process (GO:0045725) | 2.21881055 |
| 78 | fatty acid oxidation (GO:0019395) | 2.19573282 |
| 79 | primary alcohol metabolic process (GO:0034308) | 2.19463130 |
| 80 | detection of calcium ion (GO:0005513) | 2.17979433 |
| 81 | response to epinephrine (GO:0071871) | 2.17730029 |
| 82 | serine transport (GO:0032329) | 2.17661510 |
| 83 | lipid oxidation (GO:0034440) | 2.17512406 |
| 84 | positive regulation of calcium ion-dependent exocytosis (GO:0045956) | 2.17204451 |
| 85 | behavioral response to nicotine (GO:0035095) | 2.16957434 |
| 86 | glutamate secretion (GO:0014047) | 2.16530294 |
| 87 | negative regulation of macrophage derived foam cell differentiation (GO:0010745) | 2.15798218 |
| 88 | negative regulation of lipase activity (GO:0060192) | 2.15701606 |
| 89 | negative regulation of fibrinolysis (GO:0051918) | 2.15064665 |
| 90 | regulation of neuron projection regeneration (GO:0070570) | 2.14781833 |
| 91 | regulation of axon regeneration (GO:0048679) | 2.14781833 |
| 92 | positive regulation of glycogen metabolic process (GO:0070875) | 2.14380905 |
| 93 | glycerol metabolic process (GO:0006071) | 2.13815457 |
| 94 | amino-acid betaine metabolic process (GO:0006577) | 2.12486269 |
| 95 | negative regulation of platelet-derived growth factor receptor signaling pathway (GO:0010642) | 2.12089583 |
| 96 | positive regulation of sterol transport (GO:0032373) | 2.11568562 |
| 97 | positive regulation of cholesterol transport (GO:0032376) | 2.11568562 |
| 98 | nitric oxide mediated signal transduction (GO:0007263) | 2.11297857 |
| 99 | L-serine transport (GO:0015825) | 2.11011710 |
| 100 | lipid particle organization (GO:0034389) | 2.10767409 |

| Rank | Gene Set | Z-score |
|---|---|---|
| 1 | EZH2_22144423_ChIP-Seq_EOC_Human | 4.55611036 |
| 2 | PPARG_19300518_ChIP-PET_3T3-L1_Mouse | 4.03677345 |
| 3 | NR4A2_19515692_ChIP-ChIP_MN9D_Mouse | 3.16281214 |
| 4 | ESR1_17901129_ChIP-ChIP_LIVER_Mouse | 2.44225840 |
| 5 | SUZ12_18692474_ChIP-Seq_MESCs_Mouse | 2.39405773 |
| 6 | SUZ12_18555785_ChIP-Seq_MESCs_Mouse | 2.22418701 |
| 7 | SUZ12_18692474_ChIP-Seq_MEFs_Mouse | 2.17697647 |
| 8 | EED_16625203_ChIP-ChIP_MESCs_Mouse | 2.16938166 |
| 9 | EZH2_27304074_Chip-Seq_ESCs_Mouse | 2.13405988 |
| 10 | RNF2_18974828_ChIP-Seq_MESCs_Mouse | 2.12832179 |
| 11 | EZH2_18974828_ChIP-Seq_MESCs_Mouse | 2.12832179 |
| 12 | SUZ12_20075857_ChIP-Seq_MESCs_Mouse | 2.09113247 |
| 13 | MTF2_20144788_ChIP-Seq_MESCs_Mouse | 2.06061364 |
| 14 | JARID2_20064375_ChIP-Seq_MESCs_Mouse | 2.04352266 |
| 15 | FOXO1_23066095_ChIP-Seq_LIVER_Mouse | 2.03251288 |
| 16 | EZH2_27294783_Chip-Seq_ESCs_Mouse | 2.02821810 |
| 17 | THRA_23701648_ChIP-Seq_CEREBELLUM_Mouse | 1.97567730 |
| 18 | JARID2_20075857_ChIP-Seq_MESCs_Mouse | 1.97553868 |
| 19 | SUZ12_18974828_ChIP-Seq_MESCs_Mouse | 1.91938137 |
| 20 | REST_21632747_ChIP-Seq_MESCs_Mouse | 1.90190459 |
| 21 | RNF2_27304074_Chip-Seq_ESCs_Mouse | 1.86649791 |
| 22 | RXR_22158963_ChIP-Seq_LIVER_Mouse | 1.85639174 |
| 23 | SUZ12_27294783_Chip-Seq_ESCs_Mouse | 1.85632567 |
| 24 | SUZ12_16625203_ChIP-ChIP_MESCs_Mouse | 1.78910733 |
| 25 | TRIM28_21343339_ChIP-Seq_HEK293_Human | 1.71606274 |
| 26 | REST_18959480_ChIP-ChIP_MESCs_Mouse | 1.71453541 |
| 27 | CBX2_27304074_Chip-Seq_ESCs_Mouse | 1.70753699 |
| 28 | STAT3_22323479_ChIP-Seq_MACROPHAGE_Mouse | 1.68968243 |
| 29 | IKZF1_21737484_ChIP-ChIP_HCT116_Human | 1.66082352 |
| 30 | TAF7L_23326641_ChIP-Seq_C3H10T1-2_Mouse | 1.56859994 |
| 31 | GBX2_23144817_ChIP-Seq_PC3_Human | 1.54745143 |
| 32 | MYCN_19997598_ChIP-ChIP_NEUROBLASTOMA_Human | 1.53766743 |
| 33 | ESRRB_18555785_ChIP-Seq_MESCs_Mouse | 1.44237615 |
| 34 | CDKN2AIP_20523734_ChIP-Seq_CORTICAL_Neurons | 1.43844862 |
| 35 | TP53_20018659_ChIP-ChIP_R1E_Mouse | 1.35204346 |
| 36 | LXR_22158963_ChIP-Seq_LIVER_Mouse | 1.34994252 |
| 37 | RARG_19884340_ChIP-ChIP_MEFs_Mouse | 1.34607960 |
| 38 | DNAJC2_21179169_ChIP-ChIP_NT2_Human | 1.34562498 |
| 39 | PPARA_22158963_ChIP-Seq_LIVER_Mouse | 1.34436318 |
| 40 | DROSHA_22980978_ChIP-Seq_HELA_Human | 1.33530994 |
| 41 | RARB_27405468_Chip-Seq_BRAIN_Mouse | 1.32804711 |
| 42 | * CTCF_27219007_Chip-Seq_Bcells_Human | 1.30857448 |
| 43 | PHC1_16625203_ChIP-ChIP_MESCs_Mouse | 1.28408945 |
| 44 | TCF21_23034159_ChIP-ChIP_E13_GONADS_Rat | 1.27690969 |
| 45 | ZNF652_21678463_ChIP-ChIP_ZR75-1_Human | 1.23706985 |
| 46 | RCOR2_21632747_ChIP-Seq_MESCs_Mouse | 1.22047440 |
| 47 | TAL1_26923725_Chip-Seq_MACROPHAGESS_Mouse | 1.19921683 |
| 48 | PBX_27287812_Chip-Seq_EMBYONIC-LIMB_Mouse | 1.19838791 |
| 49 | GLI1_17442700_ChIP-ChIP_MESCs_Mouse | 1.18640930 |
| 50 | RING1B_27294783_Chip-Seq_ESCs_Mouse | 1.15734205 |
| 51 | PAX3-FKHR_20663909_ChIP-Seq_RHABDOMYOSARCOMA_Human | 1.11749696 |
| 52 | ERG_21242973_ChIP-ChIP_JURKAT_Human | 1.11115767 |
| 53 | ZFP57_27257070_Chip-Seq_ESCs_Mouse | 1.09478322 |
| 54 | NR1I2_20693526_ChIP-Seq_LIVER_Mouse | 1.07464989 |
| 55 | NR3C1_23031785_ChIP-Seq_PC12_Mouse | 1.04295899 |
| 56 | KDM2B_26808549_Chip-Seq_K562_Human | 1.03412336 |
| 57 | SRY_22984422_ChIP-ChIP_TESTIS_Rat | 1.03371624 |
| 58 | SOX9_25088423_ChIP-ChIP_EMBRYONIC_GONADS_Mouse | 1.01933583 |
| 59 | SRY_25088423_ChIP-ChIP_EMBRYONIC_GONADS_Mouse | 1.01397518 |
| 60 | ESR1_22446102_ChIP-Seq_UTERUS_Mouse | 1.00530549 |
| 61 | RCOR3_21632747_ChIP-Seq_MESCs_Mouse | 0.97237778 |
| 62 | RING1B_27294783_Chip-Seq_NPCs_Mouse | 0.96108489 |
| 63 | OLIG2_26023283_ChIP-Seq_AINV15_Mouse | 0.95492686 |
| 64 | PIAS1_25552417_ChIP-Seq_VCAP_Human | 0.92993895 |
| 65 | SMARCA4_23332759_ChIP-Seq_OLIGODENDROCYTES_Mouse | 0.90875071 |
| 66 | RNF2_16625203_ChIP-ChIP_MESCs_Mouse | 0.90559843 |
| 67 | EGR1_23403033_ChIP-Seq_LIVER_Mouse | 0.89754581 |
| 68 | TET1_21490601_ChIP-Seq_MESCs_Mouse | 0.89321479 |
| 69 | WT1_25993318_ChIP-Seq_PODOCYTE_Human | 0.88585879 |
| 70 | CTNNB1_20615089_ChIP-ChIP_FETAL_BRAIN_Human | 0.87582194 |
| 71 | MEIS1_26923725_Chip-Seq_HEMOGENIC-ENDOTHELIUM_Mouse | 0.86462112 |
| 72 | CDX2_19796622_ChIP-Seq_MESCs_Mouse | 0.85665659 |
| 73 | EP300_20729851_ChIP-Seq_FORBRAIN_MIDBRAIN_LIMB_HEART_Mouse | 0.85611234 |
| 74 | * EGR1_20690147_ChIP-Seq_ERYTHROLEUKEMIA_Human | 0.84626939 |
| 75 | LXR_22292898_ChIP-Seq_THP-1_Human | 0.83410892 |
| 76 | BACH1_22875853_ChIP-PCR_HELA_AND_SCP4_Human | 0.82636810 |
| 77 | NFIB_24661679_ChIP-Seq_LUNG_Mouse | 0.79980036 |
| 78 | ZFP322A_24550733_ChIP-Seq_MESCs_Mouse | 0.79348540 |
| 79 | SMC3_22415368_ChIP-Seq_MEFs_Mouse | 0.79175093 |
| 80 | KDM2B_26808549_Chip-Seq_SUP-B15_Human | 0.78268769 |
| 81 | SMAD3_22036565_ChIP-Seq_ESCs_Mouse | 0.78173649 |
| 82 | EZH2_23942234_ChIP-Seq_MYOBLASTS_AND_MYOTUBES_Mouse | 0.77266308 |
| 83 | ESR2_21235772_ChIP-Seq_MCF-7_Human | 0.76641134 |
| 84 | NRF2_20460467_ChIP-Seq_MEFs_Mouse | 0.76314933 |
| 85 | NFE2L2_20460467_ChIP-Seq_MEFs_Mouse | 0.76314933 |
| 86 | KLF4_25985364_ChIP-Seq_ATHEROSCLEROSIS_LESION_Mouse | 0.75968742 |
| 87 | BMI1_23680149_ChIP-Seq_NPCS_Mouse | 0.75445597 |
| 88 | ETV2_25802403_ChIP-Seq_MESCs_Mouse | 0.73578347 |
| 89 | AR_19668381_ChIP-Seq_PC3_Human | 0.72938966 |
| 90 | GATA2_26923725_Chip-Seq_HEMANGIOBLAST_Mouse | 0.72755321 |
| 91 | SETDB1_19884257_ChIP-Seq_MESCs_Mouse | 0.72402889 |
| 92 | RAD21_21589869_ChIP-Seq_MESCs_Mouse | 0.72258888 |
| 93 | RNF2_27304074_Chip-Seq_NSC_Mouse | 0.71267009 |
| 94 | EP300_21415370_ChIP-Seq_HL-1_Mouse | 0.71238190 |
| 95 | PPARD_23176727_ChIP-Seq_KERATINOCYTES_Mouse | 0.71151527 |
| 96 | * SOX2_21211035_ChIP-Seq_LN229_Gbm | 0.70584968 |
| 97 | LYL1_20887958_ChIP-Seq_HPC-7_Mouse | 0.69971014 |
| 98 | SA1_22415368_ChIP-Seq_MEFs_Mouse | 0.68774621 |
| 99 | NEUROD2_26341353_ChIP-Seq_CORTEX_Mouse | 0.68747133 |
| 100 | CTBP2_25329375_ChIP-Seq_LNCAP_Human | 0.68292309 |

| Rank | Gene Set | Z-score |
|---|---|---|
| 1 | MP0002139_abnormal_hepatobiliary_system | 4.10487271 |
| 2 | MP0005670_abnormal_white_adipose | 3.60726974 |
| 3 | MP0004130_abnormal_muscle_cell | 3.43031641 |
| 4 | MP0003646_muscle_fatigue | 2.57118007 |
| 5 | MP0002876_abnormal_thyroid_physiology | 2.50814424 |
| 6 | MP0005365_abnormal_bile_salt | 2.27274351 |
| 7 | MP0002971_abnormal_brown_adipose | 2.23983158 |
| 8 | MP0004859_abnormal_synaptic_plasticity | 2.15380022 |
| 9 | MP0005666_abnormal_adipose_tissue | 2.10076135 |
| 10 | MP0003195_calcinosis | 2.01377798 |
| 11 | MP0000751_myopathy | 1.98079418 |
| 12 | MP0003880_abnormal_central_pattern | 1.95861765 |
| 13 | MP0003136_yellow_coat_color | 1.89851002 |
| 14 | MP0010329_abnormal_lipoprotein_level | 1.87616341 |
| 15 | MP0004270_analgesia | 1.79250356 |
| 16 | MP0002822_catalepsy | 1.75582547 |
| 17 | MP0002064_seizures | 1.68875898 |
| 18 | MP0009840_abnormal_foam_cell | 1.67288100 |
| 19 | MP0003011_delayed_dark_adaptation | 1.66934741 |
| 20 | MP0005375_adipose_tissue_phenotype | 1.63332259 |
| 21 | MP0000749_muscle_degeneration | 1.59549166 |
| 22 | MP0002138_abnormal_hepatobiliary_system | 1.57374456 |
| 23 | MP0009745_abnormal_behavioral_response | 1.54236907 |
| 24 | MP0003635_abnormal_synaptic_transmissio | 1.51630895 |
| 25 | MP0003868_abnormal_feces_composition | 1.51501000 |
| 26 | MP0005423_abnormal_somatic_nervous | 1.51039647 |
| 27 | MP0005535_abnormal_body_temperature | 1.50343787 |
| 28 | MP0003283_abnormal_digestive_organ | 1.49460598 |
| 29 | MP0003879_abnormal_hair_cell | 1.48340729 |
| 30 | MP0002653_abnormal_ependyma_morphology | 1.46949101 |
| 31 | MP0006276_abnormal_autonomic_nervous | 1.45982038 |
| 32 | MP0002638_abnormal_pupillary_reflex | 1.42203211 |
| 33 | MP0004510_myositis | 1.41660920 |
| 34 | MP0003690_abnormal_glial_cell | 1.38252176 |
| 35 | MP0004145_abnormal_muscle_electrophysio | 1.37372481 |
| 36 | MP0002909_abnormal_adrenal_gland | 1.37370359 |
| 37 | MP0004133_heterotaxia | 1.35524381 |
| 38 | MP0003186_abnormal_redox_activity | 1.33916389 |
| 39 | MP0010386_abnormal_urinary_bladder | 1.33166871 |
| 40 | MP0002118_abnormal_lipid_homeostasis | 1.32497762 |
| 41 | MP0000604_amyloidosis | 1.31771499 |
| 42 | MP0006036_abnormal_mitochondrial_physio | 1.31640563 |
| 43 | MP0003329_amyloid_beta_deposits | 1.24022608 |
| 44 | MP0002063_abnormal_learning/memory/cond | 1.23787956 |
| 45 | MP0000778_abnormal_nervous_system | 1.22651851 |
| 46 | MP0002332_abnormal_exercise_endurance | 1.22546663 |
| 47 | MP0003633_abnormal_nervous_system | 1.16747068 |
| 48 | MP0002734_abnormal_mechanical_nocicepti | 1.16277376 |
| 49 | MP0008875_abnormal_xenobiotic_pharmacok | 1.16119403 |
| 50 | MP0005334_abnormal_fat_pad | 1.15748322 |
| 51 | MP0004142_abnormal_muscle_tone | 1.15465726 |
| 52 | MP0002272_abnormal_nervous_system | 1.14675477 |
| 53 | MP0003959_abnormal_lean_body | 1.14585359 |
| 54 | MP0005085_abnormal_gallbladder_physiolo | 1.12854450 |
| 55 | MP0002572_abnormal_emotion/affect_behav | 1.10589698 |
| 56 | MP0005503_abnormal_tendon_morphology | 1.10522812 |
| 57 | MP0003279_aneurysm | 1.10403934 |
| 58 | MP0009115_abnormal_fat_cell | 1.08663564 |
| 59 | MP0000747_muscle_weakness | 1.06648769 |
| 60 | MP0005448_abnormal_energy_balance | 1.04961206 |
| 61 | MP0003122_maternal_imprinting | 1.04640390 |
| 62 | MP0005386_behavior/neurological_phenoty | 1.03778068 |
| 63 | MP0004924_abnormal_behavior | 1.03778068 |
| 64 | MP0009046_muscle_twitch | 1.02961469 |
| 65 | MP0005584_abnormal_enzyme/coenzyme_acti | 1.02590827 |
| 66 | MP0005360_urolithiasis | 1.01416282 |
| 67 | MP0005332_abnormal_amino_acid | 0.99411118 |
| 68 | MP0001501_abnormal_sleep_pattern | 0.99341490 |
| 69 | MP0002733_abnormal_thermal_nociception | 0.99283609 |
| 70 | MP0001970_abnormal_pain_threshold | 0.99082807 |
| 71 | MP0005084_abnormal_gallbladder_morpholo | 0.98669311 |
| 72 | MP0000003_abnormal_adipose_tissue | 0.98285894 |
| 73 | MP0005620_abnormal_muscle_contractility | 0.96388753 |
| 74 | MP0000759_abnormal_skeletal_muscle | 0.94665449 |
| 75 | MP0000372_irregular_coat_pigmentation | 0.93811191 |
| 76 | MP0000343_altered_response_to | 0.93070249 |
| 77 | MP0004185_abnormal_adipocyte_glucose | 0.90652849 |
| 78 | MP0002078_abnormal_glucose_homeostasis | 0.90553772 |
| 79 | MP0005171_absent_coat_pigmentation | 0.89117120 |
| 80 | MP0002557_abnormal_social/conspecific_i | 0.88531277 |
| 81 | MP0001440_abnormal_grooming_behavior | 0.87961977 |
| 82 | MP0001905_abnormal_dopamine_level | 0.85319551 |
| 83 | MP0008569_lethality_at_weaning | 0.84598497 |
| 84 | MP0005167_abnormal_blood-brain_barrier | 0.84229007 |
| 85 | MP0002970_abnormal_white_adipose | 0.82388891 |
| 86 | MP0002735_abnormal_chemical_nociception | 0.82115309 |
| 87 | MP0001984_abnormal_olfaction | 0.81849712 |
| 88 | MP0002106_abnormal_muscle_physiology | 0.81681282 |
| 89 | MP0005058_abnormal_lysosome_morphology | 0.81660622 |
| 90 | MP0001661_extended_life_span | 0.80399088 |
| 91 | MP0002067_abnormal_sensory_capabilities | 0.80060798 |
| 92 | MP0001958_emphysema | 0.79047153 |
| 93 | MP0004087_abnormal_muscle_fiber | 0.78747625 |
| 94 | MP0005595_abnormal_vascular_smooth | 0.76599080 |
| 95 | MP0005369_muscle_phenotype | 0.74383940 |
| 96 | MP0000955_abnormal_spinal_cord | 0.73701393 |
| 97 | MP0006138_congestive_heart_failure | 0.73141082 |
| 98 | MP0001486_abnormal_startle_reflex | 0.73080759 |
| 99 | MP0002295_abnormal_pulmonary_circulatio | 0.72612690 |
| 100 | MP0003631_nervous_system_phenotype | 0.71151371 |

| Rank | Gene Set | Z-score |
|---|---|---|
| 1 | Myokymia (HP:0002411) | 4.13771743 |
| 2 | Hyperlipoproteinemia (HP:0010980) | 3.94576249 |
| 3 | Oligomenorrhea (HP:0000876) | 3.91690604 |
| 4 | Type 1 muscle fiber predominance (HP:0003803) | 3.57073031 |
| 5 | Muscle fiber inclusion bodies (HP:0100299) | 3.55994565 |
| 6 | Muscle fiber cytoplasmatic inclusion bodies (HP:0100303) | 3.41566122 |
| 7 | Nemaline bodies (HP:0003798) | 3.39672033 |
| 8 | Exercise-induced myalgia (HP:0003738) | 3.30824161 |
| 9 | 3-Methylglutaconic aciduria (HP:0003535) | 3.26805167 |
| 10 | Increased variability in muscle fiber diameter (HP:0003557) | 3.19607732 |
| 11 | Polyphagia (HP:0002591) | 3.17968368 |
| 12 | Complement deficiency (HP:0004431) | 3.12165231 |
| 13 | Abnormality of aromatic amino acid family metabolism (HP:0004338) | 3.09256160 |
| 14 | Focal motor seizures (HP:0011153) | 2.90129513 |
| 15 | Abnormality of skeletal muscle fiber size (HP:0012084) | 2.89083465 |
| 16 | Frequent falls (HP:0002359) | 2.88811638 |
| 17 | Xanthomatosis (HP:0000991) | 2.75608116 |
| 18 | Deep venous thrombosis (HP:0002625) | 2.73165535 |
| 19 | Abnormality of long-chain fatty-acid metabolism (HP:0010964) | 2.71748187 |
| 20 | Focal seizures (HP:0007359) | 2.69436120 |
| 21 | Mitral stenosis (HP:0001718) | 2.64229014 |
| 22 | Systemic lupus erythematosus (HP:0002725) | 2.62427747 |
| 23 | Abnormality of monocarboxylic acid metabolism (HP:0010996) | 2.61939767 |
| 24 | Abnormal eating behavior (HP:0100738) | 2.60731684 |
| 25 | Asymmetric septal hypertrophy (HP:0001670) | 2.48548388 |
| 26 | Distal arthrogryposis (HP:0005684) | 2.46001891 |
| 27 | Abnormality of the calf musculature (HP:0001430) | 2.40051636 |
| 28 | Muscle hypertrophy of the lower extremities (HP:0008968) | 2.39149448 |
| 29 | EMG: myopathic abnormalities (HP:0003458) | 2.35053349 |
| 30 | Calf muscle hypertrophy (HP:0008981) | 2.33768003 |
| 31 | Hyporeflexia of lower limbs (HP:0002600) | 2.27905369 |
| 32 | Infantile muscular hypotonia (HP:0008947) | 2.26454700 |
| 33 | Abnormality of complement system (HP:0005339) | 2.25273037 |
| 34 | Hypertriglyceridemia (HP:0002155) | 2.17122476 |
| 35 | Epidermoid cyst (HP:0200040) | 2.17108151 |
| 36 | Insulin-resistant diabetes mellitus (HP:0000831) | 2.17043889 |
| 37 | Muscle fiber splitting (HP:0003555) | 2.16670886 |
| 38 | Acanthosis nigricans (HP:0000956) | 2.14577362 |
| 39 | Difficulty running (HP:0009046) | 2.13606867 |
| 40 | Abnormality of fatty-acid metabolism (HP:0004359) | 2.12493653 |
| 41 | Turricephaly (HP:0000262) | 2.10891536 |
| 42 | Torticollis (HP:0000473) | 2.09928804 |
| 43 | Hypoalphalipoproteinemia (HP:0003233) | 2.08970752 |
| 44 | Amblyopia (HP:0000646) | 2.08420221 |
| 45 | Papilledema (HP:0001085) | 2.05572370 |
| 46 | Ulnar deviation of the wrist (HP:0003049) | 2.01499283 |
| 47 | Myoglobinuria (HP:0002913) | 2.00480922 |
| 48 | Action tremor (HP:0002345) | 1.98460530 |
| 49 | Abnormality of glycolipid metabolism (HP:0010969) | 1.98033556 |
| 50 | Abnormality of liposaccharide metabolism (HP:0010968) | 1.98033556 |
| 51 | Abnormality of glycosphingolipid metabolism (HP:0004343) | 1.98033556 |
| 52 | Ankle clonus (HP:0011448) | 1.97366652 |
| 53 | Skin nodule (HP:0200036) | 1.96977794 |
| 54 | Increased muscle lipid content (HP:0009058) | 1.96059879 |
| 55 | Rhabdomyolysis (HP:0003201) | 1.90251589 |
| 56 | Mutism (HP:0002300) | 1.87504161 |
| 57 | Agitation (HP:0000713) | 1.86970477 |
| 58 | Prolonged QT interval (HP:0001657) | 1.86566054 |
| 59 | Protrusio acetabuli (HP:0003179) | 1.85355669 |
| 60 | Increased serum pyruvate (HP:0003542) | 1.84925372 |
| 61 | Arthropathy (HP:0003040) | 1.82805355 |
| 62 | Axonal loss (HP:0003447) | 1.82426608 |
| 63 | Spastic tetraparesis (HP:0001285) | 1.82025577 |
| 64 | Insulin resistance (HP:0000855) | 1.81461497 |
| 65 | Bundle branch block (HP:0011710) | 1.81430239 |
| 66 | Glomerulonephritis (HP:0000099) | 1.80072749 |
| 67 | Gowers sign (HP:0003391) | 1.78523078 |
| 68 | Abnormality of the level of lipoprotein cholesterol (HP:0010979) | 1.77860119 |
| 69 | Myotonia (HP:0002486) | 1.76814469 |
| 70 | Broad-based gait (HP:0002136) | 1.76533511 |
| 71 | Peritonitis (HP:0002586) | 1.76381174 |
| 72 | Delayed gross motor development (HP:0002194) | 1.75863664 |
| 73 | Abnormality of dicarboxylic acid metabolism (HP:0010995) | 1.75473175 |
| 74 | Dicarboxylic aciduria (HP:0003215) | 1.75473175 |
| 75 | Fetal akinesia sequence (HP:0001989) | 1.74159941 |
| 76 | Visual hallucinations (HP:0002367) | 1.73222119 |
| 77 | Muscle stiffness (HP:0003552) | 1.71689170 |
| 78 | Delayed CNS myelination (HP:0002188) | 1.71620232 |
| 79 | Limb dystonia (HP:0002451) | 1.71572548 |
| 80 | Subaortic stenosis (HP:0001682) | 1.71360186 |
| 81 | Abnormality of the left ventricular outflow tract (HP:0011103) | 1.71360186 |
| 82 | Dysostosis multiplex (HP:0000943) | 1.69861343 |
| 83 | Heart block (HP:0012722) | 1.68422906 |
| 84 | Round ear (HP:0100830) | 1.67920577 |
| 85 | Atrioventricular block (HP:0001678) | 1.67641869 |
| 86 | Vertebral compression fractures (HP:0002953) | 1.65597088 |
| 87 | * Focal dystonia (HP:0004373) | 1.65543926 |
| 88 | Brushfield spots (HP:0001088) | 1.62938724 |
| 89 | Bulbar palsy (HP:0001283) | 1.60953581 |
| 90 | Exercise-induced muscle cramps (HP:0003710) | 1.60722958 |
| 91 | Neonatal onset (HP:0003623) | 1.60364702 |
| 92 | Generalized tonic-clonic seizures (HP:0002069) | 1.59939862 |
| 93 | Abnormality of glycolysis (HP:0004366) | 1.58258123 |
| 94 | Pachygyria (HP:0001302) | 1.58212709 |
| 95 | Sleep apnea (HP:0010535) | 1.57769755 |
| 96 | * Craniofacial dystonia (HP:0012179) | 1.56972430 |
| 97 | Abnormal atrioventricular conduction (HP:0005150) | 1.55252966 |
| 98 | Progressive cerebellar ataxia (HP:0002073) | 1.53664036 |
| 99 | Joint hemorrhage (HP:0005261) | 1.53605965 |
| 100 | Abnormal EKG (HP:0003115) | 1.53428329 |

| Rank | Gene Set | Z-score |
|---|---|---|
| 1 | MARK1 | 4.24630872 |
| 2 | PINK1 | 3.52542722 |
| 3 | LIMK1 | 2.77031460 |
| 4 | OBSCN | 2.62250143 |
| 5 | PHKG2 | 2.44172619 |
| 6 | PHKG1 | 2.44172619 |
| 7 | EPHB2 | 2.19474993 |
| 8 | TRIB3 | 2.11660783 |
| 9 | STK16 | 2.05562278 |
| 10 | EPHA3 | 1.98749287 |
| 11 | TIE1 | 1.85008650 |
| 12 | NTRK2 | 1.77177211 |
| 13 | MAPK13 | 1.75854089 |
| 14 | CAMKK2 | 1.74951767 |
| 15 | NTRK3 | 1.73919990 |
| 16 | CASK | 1.69327968 |
| 17 | DAPK2 | 1.63378301 |
| 18 | ABL2 | 1.57649339 |
| 19 | CAMK1 | 1.57493506 |
| 20 | EPHA4 | 1.55943787 |
| 21 | PAK6 | 1.49276812 |
| 22 | MAPK12 | 1.43943119 |
| 23 | MAP3K11 | 1.32762478 |
| 24 | DDR2 | 1.30831431 |
| 25 | CAMKK1 | 1.28827087 |
| 26 | MAP2K7 | 1.22487840 |
| 27 | MAP2K4 | 1.20927238 |
| 28 | TTN | 1.20067945 |
| 29 | PAK3 | 1.17652224 |
| 30 | ADRBK2 | 1.13065652 |
| 31 | PRKAA2 | 1.10521847 |
| 32 | NTRK1 | 1.06200300 |
| 33 | PKN1 | 1.05098216 |
| 34 | CDC42BPA | 1.02847485 |
| 35 | PRKCG | 1.00375597 |
| 36 | PRKCH | 0.95199183 |
| 37 | SGK223 | 0.94577178 |
| 38 | SGK494 | 0.94577178 |
| 39 | MYLK | 0.93719697 |
| 40 | TYRO3 | 0.92784945 |
| 41 | MINK1 | 0.90361582 |
| 42 | MAP3K4 | 0.90216435 |
| 43 | SGK2 | 0.89037272 |
| 44 | DYRK2 | 0.88253743 |
| 45 | STK11 | 0.87716547 |
| 46 | MAP3K6 | 0.86697277 |
| 47 | IRAK2 | 0.84354659 |
| 48 | MAPK4 | 0.83937040 |
| 49 | TNIK | 0.81077254 |
| 50 | BMPR1B | 0.80843094 |
| 51 | CDK5 | 0.80786846 |
| 52 | CAMK1D | 0.79780925 |
| 53 | BCKDK | 0.75006515 |
| 54 | PRKD2 | 0.74611708 |
| 55 | RIPK1 | 0.72889359 |
| 56 | PRKCZ | 0.72453952 |
| 57 | CSNK1G2 | 0.69680290 |
| 58 | PDPK1 | 0.69306215 |
| 59 | UHMK1 | 0.68592112 |
| 60 | CAMK4 | 0.67288036 |
| 61 | GRK5 | 0.67143743 |
| 62 | SGK3 | 0.66490594 |
| 63 | MARK2 | 0.64744697 |
| 64 | FGFR2 | 0.63861627 |
| 65 | TNK2 | 0.63553424 |
| 66 | MAP4K2 | 0.62815507 |
| 67 | PIK3CA | 0.59147591 |
| 68 | PRKACA | 0.59073358 |
| 69 | PRKAA1 | 0.59068193 |
| 70 | JAK1 | 0.57864341 |
| 71 | CAMK2B | 0.57614945 |
| 72 | CAMK2A | 0.57585163 |
| 73 | ADRBK1 | 0.56638577 |
| 74 | DAPK3 | 0.55117455 |
| 75 | PRKG1 | 0.54646003 |
| 76 | DMPK | 0.54044106 |
| 77 | TGFBR2 | 0.53967020 |
| 78 | ROCK1 | 0.53962666 |
| 79 | GRK1 | 0.53580854 |
| 80 | DYRK1B | 0.53432791 |
| 81 | TESK1 | 0.53345664 |
| 82 | PRKACG | 0.52606696 |
| 83 | TYK2 | 0.52052719 |
| 84 | PDK1 | 0.51836205 |
| 85 | PRKG2 | 0.51799800 |
| 86 | ROCK2 | 0.50208165 |
| 87 | PRKD1 | 0.50178495 |
| 88 | ILK | 0.47643661 |
| 89 | FRK | 0.46414613 |
| 90 | CAMK2G | 0.44378802 |
| 91 | GSK3A | 0.44328605 |
| 92 | NEK9 | 0.43646097 |
| 93 | PIK3CG | 0.41808876 |
| 94 | LATS2 | 0.41776005 |
| 95 | RPS6KA3 | 0.41234448 |
| 96 | CDK14 | 0.39274856 |
| 97 | CAMK2D | 0.38970313 |
| 98 | MAP2K3 | 0.38947519 |
| 99 | STK38 | 0.37983230 |
| 100 | SGK1 | 0.37427787 |

| Rank | Gene Set | Z-score |
|---|---|---|
| 1 | PPAR signaling pathway_Homo sapiens_hsa03320 | 2.47518904 |
| 2 | Biosynthesis of unsaturated fatty acids_Homo sapiens_hsa01040 | 2.28993740 |
| 3 | Fatty acid degradation_Homo sapiens_hsa00071 | 2.21771776 |
| 4 | Primary bile acid biosynthesis_Homo sapiens_hsa00120 | 2.18365494 |
| 5 | Regulation of lipolysis in adipocytes_Homo sapiens_hsa04923 | 2.11247353 |
| 6 | Glycine, serine and threonine metabolism_Homo sapiens_hsa00260 | 2.02632165 |
| 7 | Butanoate metabolism_Homo sapiens_hsa00650 | 2.02231395 |
| 8 | Propanoate metabolism_Homo sapiens_hsa00640 | 1.89910946 |
| 9 | Tryptophan metabolism_Homo sapiens_hsa00380 | 1.81236089 |
| 10 | Phenylalanine metabolism_Homo sapiens_hsa00360 | 1.80761419 |
| 11 | Glycerolipid metabolism_Homo sapiens_hsa00561 | 1.80562561 |
| 12 | Synthesis and degradation of ketone bodies_Homo sapiens_hsa00072 | 1.79274624 |
| 13 | Pyruvate metabolism_Homo sapiens_hsa00620 | 1.77267889 |
| 14 | beta-Alanine metabolism_Homo sapiens_hsa00410 | 1.76819202 |
| 15 | Ascorbate and aldarate metabolism_Homo sapiens_hsa00053 | 1.75951663 |
| 16 | Ubiquinone and other terpenoid-quinone biosynthesis_Homo sapiens_hsa00130 | 1.70441591 |
| 17 | Sulfur relay system_Homo sapiens_hsa04122 | 1.69078023 |
| 18 | Valine, leucine and isoleucine degradation_Homo sapiens_hsa00280 | 1.63281835 |
| 19 | Phenylalanine, tyrosine and tryptophan biosynthesis_Homo sapiens_hsa00400 | 1.60689430 |
| 20 | Glyoxylate and dicarboxylate metabolism_Homo sapiens_hsa00630 | 1.56685781 |
| 21 | Peroxisome_Homo sapiens_hsa04146 | 1.55156819 |
| 22 | Vitamin B6 metabolism_Homo sapiens_hsa00750 | 1.52154515 |
| 23 | Retinol metabolism_Homo sapiens_hsa00830 | 1.47332968 |
| 24 | Sulfur metabolism_Homo sapiens_hsa00920 | 1.47119838 |
| 25 | Complement and coagulation cascades_Homo sapiens_hsa04610 | 1.44133420 |
| 26 | Fatty acid metabolism_Homo sapiens_hsa01212 | 1.43334871 |
| 27 | Drug metabolism - cytochrome P450_Homo sapiens_hsa00982 | 1.38762942 |
| 28 | Histidine metabolism_Homo sapiens_hsa00340 | 1.36204422 |
| 29 | Tyrosine metabolism_Homo sapiens_hsa00350 | 1.35786486 |
| 30 | Fatty acid elongation_Homo sapiens_hsa00062 | 1.29589315 |
| 31 | Cardiac muscle contraction_Homo sapiens_hsa04260 | 1.22370991 |
| 32 | Steroid hormone biosynthesis_Homo sapiens_hsa00140 | 1.21355052 |
| 33 | Synaptic vesicle cycle_Homo sapiens_hsa04721 | 1.19369071 |
| 34 | 2-Oxocarboxylic acid metabolism_Homo sapiens_hsa01210 | 1.18099016 |
| 35 | Glycosphingolipid biosynthesis - ganglio series_Homo sapiens_hsa00604 | 1.15059974 |
| 36 | Oxidative phosphorylation_Homo sapiens_hsa00190 | 1.13631204 |
| 37 | Adipocytokine signaling pathway_Homo sapiens_hsa04920 | 1.13395876 |
| 38 | Fatty acid biosynthesis_Homo sapiens_hsa00061 | 1.10280486 |
| 39 | Taurine and hypotaurine metabolism_Homo sapiens_hsa00430 | 1.10153239 |
| 40 | Cocaine addiction_Homo sapiens_hsa05030 | 1.09601096 |
| 41 | Arginine biosynthesis_Homo sapiens_hsa00220 | 1.07963306 |
| 42 | Arginine and proline metabolism_Homo sapiens_hsa00330 | 1.07895478 |
| 43 | Bile secretion_Homo sapiens_hsa04976 | 1.07626157 |
| 44 | Nicotine addiction_Homo sapiens_hsa05033 | 1.06302333 |
| 45 | Chemical carcinogenesis_Homo sapiens_hsa05204 | 1.05081813 |
| 46 | Non-alcoholic fatty liver disease (NAFLD)_Homo sapiens_hsa04932 | 1.02949355 |
| 47 | Metabolism of xenobiotics by cytochrome P450_Homo sapiens_hsa00980 | 1.02053923 |
| 48 | Pentose and glucuronate interconversions_Homo sapiens_hsa00040 | 1.00133532 |
| 49 | Caffeine metabolism_Homo sapiens_hsa00232 | 0.97157051 |
| 50 | Fat digestion and absorption_Homo sapiens_hsa04975 | 0.94516100 |
| 51 | AMPK signaling pathway_Homo sapiens_hsa04152 | 0.94437047 |
| 52 | Morphine addiction_Homo sapiens_hsa05032 | 0.93400679 |
| 53 | GABAergic synapse_Homo sapiens_hsa04727 | 0.92827341 |
| 54 | Glycosaminoglycan degradation_Homo sapiens_hsa00531 | 0.90090771 |
| 55 | Dilated cardiomyopathy_Homo sapiens_hsa05414 | 0.89628514 |
| 56 | Proximal tubule bicarbonate reclamation_Homo sapiens_hsa04964 | 0.87596557 |
| 57 | Parkinsons disease_Homo sapiens_hsa05012 | 0.87352824 |
| 58 | Alanine, aspartate and glutamate metabolism_Homo sapiens_hsa00250 | 0.86058089 |
| 59 | Retrograde endocannabinoid signaling_Homo sapiens_hsa04723 | 0.84742265 |
| 60 | Adrenergic signaling in cardiomyocytes_Homo sapiens_hsa04261 | 0.83940697 |
| 61 | Insulin secretion_Homo sapiens_hsa04911 | 0.80361588 |
| 62 | Circadian entrainment_Homo sapiens_hsa04713 | 0.79541624 |
| 63 | Hypertrophic cardiomyopathy (HCM)_Homo sapiens_hsa05410 | 0.79094121 |
| 64 | Renin secretion_Homo sapiens_hsa04924 | 0.76835082 |
| 65 | Cyanoamino acid metabolism_Homo sapiens_hsa00460 | 0.76670706 |
| 66 | Dopaminergic synapse_Homo sapiens_hsa04728 | 0.74509508 |
| 67 | Glycosaminoglycan biosynthesis - chondroitin sulfate / dermatan sulfate_Homo sapiens_hsa00532 | 0.73818095 |
| 68 | Aldosterone synthesis and secretion_Homo sapiens_hsa04925 | 0.70170054 |
| 69 | Collecting duct acid secretion_Homo sapiens_hsa04966 | 0.70151465 |
| 70 | Glutamatergic synapse_Homo sapiens_hsa04724 | 0.67654258 |
| 71 | Glucagon signaling pathway_Homo sapiens_hsa04922 | 0.67479760 |
| 72 | Type II diabetes mellitus_Homo sapiens_hsa04930 | 0.67350769 |
| 73 | Ovarian steroidogenesis_Homo sapiens_hsa04913 | 0.65606837 |
| 74 | Alzheimers disease_Homo sapiens_hsa05010 | 0.64705141 |
| 75 | Cholinergic synapse_Homo sapiens_hsa04725 | 0.64296961 |
| 76 | Linoleic acid metabolism_Homo sapiens_hsa00591 | 0.63338038 |
| 77 | Starch and sucrose metabolism_Homo sapiens_hsa00500 | 0.62779278 |
| 78 | Amphetamine addiction_Homo sapiens_hsa05031 | 0.62750170 |
| 79 | Maturity onset diabetes of the young_Homo sapiens_hsa04950 | 0.61864107 |
| 80 | Insulin signaling pathway_Homo sapiens_hsa04910 | 0.58224531 |
| 81 | Insulin resistance_Homo sapiens_hsa04931 | 0.57173218 |
| 82 | Vascular smooth muscle contraction_Homo sapiens_hsa04270 | 0.56288781 |
| 83 | Carbon metabolism_Homo sapiens_hsa01200 | 0.53540182 |
| 84 | Axon guidance_Homo sapiens_hsa04360 | 0.51960298 |
| 85 | Citrate cycle (TCA cycle)_Homo sapiens_hsa00020 | 0.51911283 |
| 86 | Calcium signaling pathway_Homo sapiens_hsa04020 | 0.51581662 |
| 87 | cAMP signaling pathway_Homo sapiens_hsa04024 | 0.49251987 |
| 88 | Oxytocin signaling pathway_Homo sapiens_hsa04921 | 0.49041172 |
| 89 | Vasopressin-regulated water reabsorption_Homo sapiens_hsa04962 | 0.48440622 |
| 90 | Terpenoid backbone biosynthesis_Homo sapiens_hsa00900 | 0.46801120 |
| 91 | ABC transporters_Homo sapiens_hsa02010 | 0.45585584 |
| 92 | alpha-Linolenic acid metabolism_Homo sapiens_hsa00592 | 0.44830896 |
| 93 | Neuroactive ligand-receptor interaction_Homo sapiens_hsa04080 | 0.43428838 |
| 94 | Folate biosynthesis_Homo sapiens_hsa00790 | 0.40458931 |
| 95 | cGMP-PKG signaling pathway_Homo sapiens_hsa04022 | 0.40444360 |
| 96 | Longevity regulating pathway - mammal_Homo sapiens_hsa04211 | 0.38955792 |
| 97 | Carbohydrate digestion and absorption_Homo sapiens_hsa04973 | 0.37174796 |
| 98 | Other glycan degradation_Homo sapiens_hsa00511 | 0.34445013 |
| 99 | Glycosaminoglycan biosynthesis - heparan sulfate / heparin_Homo sapiens_hsa00534 | 0.33588342 |
| 100 | Sphingolipid metabolism_Homo sapiens_hsa00600 | 0.33285314 |