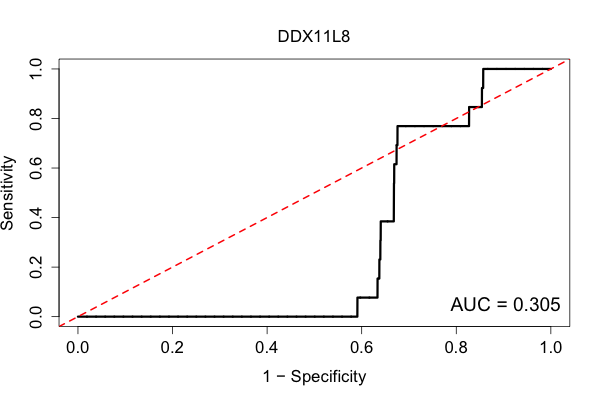
| Rank | Gene Set | Z-score |
|---|---|---|
| 1 | thrombin receptor signaling pathway (GO:0070493) | 8.30937610 |
| 2 | protein neddylation (GO:0045116) | 7.25005524 |
| 3 | regulation of platelet aggregation (GO:0090330) | 6.90728773 |
| 4 | neutrophil activation involved in immune response (GO:0002283) | 6.13245162 |
| 5 | adenosine receptor signaling pathway (GO:0001973) | 5.90659167 |
| 6 | regulation of platelet activation (GO:0010543) | 5.63432166 |
| 7 | triglyceride-rich lipoprotein particle remodeling (GO:0034370) | 5.25217097 |
| 8 | fusion of sperm to egg plasma membrane (GO:0007342) | 5.08010008 |
| 9 | purinergic nucleotide receptor signaling pathway (GO:0035590) | 4.81561385 |
| 10 | regulation of Golgi to plasma membrane protein transport (GO:0042996) | 4.81326180 |
| 11 | lipoxygenase pathway (GO:0019372) | 4.68355890 |
| 12 | positive regulation of mast cell activation (GO:0033005) | 4.59907588 |
| 13 | negative regulation of macrophage derived foam cell differentiation (GO:0010745) | 4.53636399 |
| 14 | G-protein coupled purinergic nucleotide receptor signaling pathway (GO:0035589) | 4.52117287 |
| 15 | megakaryocyte development (GO:0035855) | 4.51873355 |
| 16 | blood coagulation, intrinsic pathway (GO:0007597) | 4.51616864 |
| 17 | leukocyte migration involved in inflammatory response (GO:0002523) | 4.43189611 |
| 18 | positive regulation of protein homodimerization activity (GO:0090073) | 4.29061061 |
| 19 | negative regulation of norepinephrine secretion (GO:0010700) | 4.22978651 |
| 20 | negative regulation of heart rate (GO:0010459) | 4.22003505 |
| 21 | regulation of integrin-mediated signaling pathway (GO:2001044) | 4.17849003 |
| 22 | poly(A)+ mRNA export from nucleus (GO:0016973) | 4.07798059 |
| 23 | purinergic receptor signaling pathway (GO:0035587) | 4.07485390 |
| 24 | platelet formation (GO:0030220) | 4.01354384 |
| 25 | negative regulation of hematopoietic progenitor cell differentiation (GO:1901533) | 3.90772323 |
| 26 | platelet aggregation (GO:0070527) | 3.87052359 |
| 27 | negative regulation of thymocyte apoptotic process (GO:0070244) | 3.86523251 |
| 28 | regulation of homotypic cell-cell adhesion (GO:0034110) | 3.86334562 |
| 29 | positive regulation of interleukin-17 production (GO:0032740) | 3.80036143 |
| 30 | plasma membrane fusion (GO:0045026) | 3.78204582 |
| 31 | regulation of megakaryocyte differentiation (GO:0045652) | 3.73520877 |
| 32 | positive regulation of mast cell degranulation (GO:0043306) | 3.68212204 |
| 33 | positive regulation of mast cell activation involved in immune response (GO:0033008) | 3.68212204 |
| 34 | positive regulation of granulocyte differentiation (GO:0030854) | 3.65422075 |
| 35 | positive regulation of cAMP-mediated signaling (GO:0043950) | 3.63863282 |
| 36 | low-density lipoprotein particle remodeling (GO:0034374) | 3.63766991 |
| 37 | negative regulation of platelet activation (GO:0010544) | 3.62793068 |
| 38 | monoamine transport (GO:0015844) | 3.61387468 |
| 39 | angiogenesis involved in wound healing (GO:0060055) | 3.56072579 |
| 40 | regulation of memory T cell differentiation (GO:0043380) | 3.55184034 |
| 41 | negative regulation of neural precursor cell proliferation (GO:2000178) | 3.54213582 |
| 42 | ether lipid metabolic process (GO:0046485) | 3.53160383 |
| 43 | cardiolipin metabolic process (GO:0032048) | 3.52971396 |
| 44 | G-protein coupled purinergic receptor signaling pathway (GO:0035588) | 3.52044832 |
| 45 | high-density lipoprotein particle remodeling (GO:0034375) | 3.49876154 |
| 46 | definitive hemopoiesis (GO:0060216) | 3.49123804 |
| 47 | negative regulation of response to food (GO:0032096) | 3.48226178 |
| 48 | negative regulation of appetite (GO:0032099) | 3.48226178 |
| 49 | negative regulation of protein localization to plasma membrane (GO:1903077) | 3.47686216 |
| 50 | positive regulation of endothelial cell differentiation (GO:0045603) | 3.47445240 |
| 51 | regulation of skeletal muscle contraction (GO:0014819) | 3.46081990 |
| 52 | regulation of mitochondrial depolarization (GO:0051900) | 3.43570222 |
| 53 | deoxyribonucleoside monophosphate metabolic process (GO:0009162) | 3.39656206 |
| 54 | negative regulation of homotypic cell-cell adhesion (GO:0034111) | 3.35900441 |
| 55 | regulation of lipoprotein metabolic process (GO:0050746) | 3.28290624 |
| 56 | negative regulation of establishment of protein localization to plasma membrane (GO:0090005) | 3.25932604 |
| 57 | response to pheromone (GO:0019236) | 3.25416167 |
| 58 | neutrophil activation (GO:0042119) | 3.21558806 |
| 59 | germinal center formation (GO:0002467) | 3.20709614 |
| 60 | cyclooxygenase pathway (GO:0019371) | 3.19121324 |
| 61 | regulation of macrophage derived foam cell differentiation (GO:0010743) | 3.18811909 |
| 62 | reverse cholesterol transport (GO:0043691) | 3.17523377 |
| 63 | mature B cell differentiation involved in immune response (GO:0002313) | 3.16741111 |
| 64 | endothelium development (GO:0003158) | 3.15456392 |
| 65 | negative regulation of T cell apoptotic process (GO:0070233) | 3.15291588 |
| 66 | positive regulation of systemic arterial blood pressure (GO:0003084) | 3.14682648 |
| 67 | peptide catabolic process (GO:0043171) | 3.14550772 |
| 68 | vesicle targeting (GO:0006903) | 3.12876737 |
| 69 | regulation of mast cell degranulation (GO:0043304) | 3.08476143 |
| 70 | polyamine biosynthetic process (GO:0006596) | 3.06400102 |
| 71 | relaxation of smooth muscle (GO:0044557) | 3.06190487 |
| 72 | regulation of mast cell activation involved in immune response (GO:0033006) | 3.01246922 |
| 73 | negative regulation of protein localization to cell surface (GO:2000009) | 2.99229473 |
| 74 | positive regulation of Rho protein signal transduction (GO:0035025) | 2.98971436 |
| 75 | phosphatidylinositol acyl-chain remodeling (GO:0036149) | 2.96211374 |
| 76 | negative regulation of calcium ion transport into cytosol (GO:0010523) | 2.96161607 |
| 77 | platelet activation (GO:0030168) | 2.95731556 |
| 78 | pyrimidine deoxyribonucleotide metabolic process (GO:0009219) | 2.94287926 |
| 79 | regulation of integrin activation (GO:0033623) | 2.94093280 |
| 80 | regulation of mast cell activation (GO:0033003) | 2.92668849 |
| 81 | sleep (GO:0030431) | 2.90303848 |
| 82 | positive regulation of alpha-beta T cell proliferation (GO:0046641) | 2.89546884 |
| 83 | regulation of interleukin-17 production (GO:0032660) | 2.89225505 |
| 84 | regulation of cholesterol efflux (GO:0010874) | 2.85849008 |
| 85 | pyrimidine deoxyribonucleotide catabolic process (GO:0009223) | 2.84279483 |
| 86 | granulocyte activation (GO:0036230) | 2.82637356 |
| 87 | beta-amyloid metabolic process (GO:0050435) | 2.80866982 |
| 88 | positive regulation of granulocyte macrophage colony-stimulating factor production (GO:0032725) | 2.79870927 |
| 89 | pyrimidine nucleoside catabolic process (GO:0046135) | 2.79382470 |
| 90 | regulation of histone H3-K9 methylation (GO:0051570) | 2.77603003 |
| 91 | regulation of norepinephrine secretion (GO:0014061) | 2.71464505 |
| 92 | platelet degranulation (GO:0002576) | 2.71026040 |
| 93 | dopamine transport (GO:0015872) | 2.69352530 |
| 94 | fatty acid elongation (GO:0030497) | 2.68902234 |
| 95 | mitochondrial calcium ion transport (GO:0006851) | 2.68827771 |
| 96 | positive regulation of interleukin-4 production (GO:0032753) | 2.66121457 |
| 97 | positive regulation of mitochondrial calcium ion concentration (GO:0051561) | 2.65377089 |
| 98 | negative regulation of ryanodine-sensitive calcium-release channel activity (GO:0060315) | 2.65039436 |
| 99 | long-chain fatty acid biosynthetic process (GO:0042759) | 2.64789322 |
| 100 | regulation of MHC class II biosynthetic process (GO:0045346) | 2.64438221 |

| Rank | Gene Set | Z-score |
|---|---|---|
| 1 | SCL_19346495_ChIP-Seq_HPC-7_Human | 4.68387295 |
| 2 | SCL_21571218_ChIP-Seq_MEGAKARYOCYTES_Human | 4.30017577 |
| 3 | LYL1_20887958_ChIP-Seq_HPC-7_Mouse | 4.12983045 |
| 4 | GATA1_21571218_ChIP-Seq_MEGAKARYOCYTES_Human | 2.98364862 |
| 5 | RUNX1_20887958_ChIP-Seq_HPC-7_Mouse | 2.97718267 |
| 6 | PRDM16_22522345_ChIP-ChIP_PALATE_MESENCHYMAL_Mouse | 2.91407618 |
| 7 | GATA1_19941826_ChIP-Seq_K562_Human | 2.79916006 |
| 8 | MECOM_23826213_ChIP-Seq_KASUMI_Mouse | 2.73833900 |
| 9 | IGF1R_20145208_ChIP-Seq_DFB_Human | 2.63000143 |
| 10 | LMO2_20887958_ChIP-Seq_HPC-7_Mouse | 2.60248006 |
| 11 | IKZF1_21737484_ChIP-ChIP_HCT116_Human | 2.33330858 |
| 12 | GATA2_19941826_ChIP-Seq_K562_Human | 2.18809014 |
| 13 | HTT_18923047_ChIP-ChIP_STHdh_Human | 2.14550292 |
| 14 | GATA2_20887958_ChIP-Seq_HPC-7_Mouse | 2.08151107 |
| 15 | TAF15_26573619_Chip-Seq_HEK293_Human | 2.07226794 |
| 16 | GATA1_19941827_ChIP-Seq_MEL_Mouse | 2.05020999 |
| 17 | IRF1_21803131_ChIP-Seq_MONOCYTES_Human | 1.91625542 |
| 18 | GATA1_22383799_ChIP-Seq_G1ME_Mouse | 1.91329449 |
| 19 | EWS-ERG_20517297_ChIP-Seq_CADO-ES1_Human | 1.89397875 |
| 20 | GBX2_23144817_ChIP-Seq_PC3_Human | 1.88600505 |
| 21 | GATA1_22025678_ChIP-Seq_K562_Human | 1.88222557 |
| 22 | ELF1_17652178_ChIP-ChIP_JURKAT_Human | 1.86580800 |
| 23 | GATA2_21666600_ChIP-Seq_HMVEC_Human | 1.82060534 |
| 24 | STAT6_21828071_ChIP-Seq_BEAS2B_Human | 1.81171838 |
| 25 | IRF8_21731497_ChIP-ChIP_J774_Mouse | 1.78006722 |
| 26 | VDR_22108803_ChIP-Seq_LS180_Human | 1.77002387 |
| 27 | ELK4_26923725_Chip-Seq_MESODERM_Mouse | 1.70930740 |
| 28 | POU3F2_20337985_ChIP-ChIP_501MEL_Human | 1.69512944 |
| 29 | MEIS1_20887958_ChIP-Seq_HPC-7_Mouse | 1.66703268 |
| 30 | RUNX1_22412390_ChIP-Seq_EML_Mouse | 1.66700158 |
| 31 | IRF1_19129219_ChIP-ChIP_H3396_Human | 1.60102688 |
| 32 | SPI1_23127762_ChIP-Seq_K562_Human | 1.58644290 |
| 33 | TAL1_20566737_ChIP-Seq_PRIMARY_FETAL_LIVER_ERYTHROID_Mouse | 1.58384192 |
| 34 | SRY_22984422_ChIP-ChIP_TESTIS_Rat | 1.57542586 |
| 35 | EWS_26573619_Chip-Seq_HEK293_Human | 1.57189510 |
| 36 | EZH2_22144423_ChIP-Seq_EOC_Human | 1.54400145 |
| 37 | BP1_19119308_ChIP-ChIP_Hs578T_Human | 1.54271415 |
| 38 | IRF8_22096565_ChIP-ChIP_GC-B_Mouse | 1.52595707 |
| 39 | GATA1_19941827_ChIP-Seq_MEL86_Mouse | 1.47284983 |
| 40 | RUNX1_26923725_Chip-Seq_MACROPHAGESS_Mouse | 1.45909983 |
| 41 | ER_23166858_ChIP-Seq_MCF-7_Human | 1.43508539 |
| 42 | CDX2_19796622_ChIP-Seq_MESCs_Mouse | 1.43198471 |
| 43 | FOXP3_17237761_ChIP-ChIP_TREG_Mouse | 1.42073468 |
| 44 | Nerf2_26677805_Chip-Seq_MACROPHAGESS_Mouse | 1.40820014 |
| 45 | VDR_24763502_ChIP-Seq_THP-1_Human | 1.40585370 |
| 46 | GATA2_22383799_ChIP-Seq_G1ME_Mouse | 1.40107802 |
| 47 | UTX_26944678_Chip-Seq_JUKART_Human | 1.37589485 |
| 48 | GATA3_21878914_ChIP-Seq_MCF-7_Human | 1.37488170 |
| 49 | GATA2_26923725_Chip-Seq_HEMANGIOBLAST_Mouse | 1.31019174 |
| 50 | ETS1_22383799_ChIP-Seq_G1ME_Mouse | 1.29870889 |
| 51 | HOXA2_22223247_ChIP-Seq_E11.5_EMBRYO_Mouse | 1.28174206 |
| 52 | E2A_27217539_Chip-Seq_RAMOS-Cell_line_Human | 1.24950459 |
| 53 | GATA3_27048872_Chip-Seq_THYMUS_Human | 1.20956674 |
| 54 | STAT6_20620947_ChIP-Seq_CD4_POS_T_Human | 1.20786732 |
| 55 | YY1_22570637_ChIP-Seq_MALME-3M_Human | 1.19859917 |
| 56 | NANOG_20526341_ChIP-Seq_ESCs_Human | 1.18187807 |
| 57 | MYB_21317192_ChIP-Seq_ERMYB_Mouse | 1.16671092 |
| 58 | FOXA1_21572438_ChIP-Seq_LNCaP_Human | 1.15611009 |
| 59 | PPARD_23208498_ChIP-Seq_MDA-MB-231_Human | 1.14301665 |
| 60 | SALL4_22934838_ChIP-ChIP_CD34+_Human | 1.13826724 |
| 61 | ZNF274_21170338_ChIP-Seq_K562_Hela | 1.11210812 |
| 62 | EGR1_23403033_ChIP-Seq_LIVER_Mouse | 1.10201567 |
| 63 | TP53_22573176_ChIP-Seq_HFKS_Human | 1.09723313 |
| 64 | ERG_20517297_ChIP-Seq_VCAP_Human | 1.09549099 |
| 65 | EBNA1_20929547_Chip-Seq_RAJI-cells_Human | 1.09414166 |
| 66 | SPI1_20517297_ChIP-Seq_HL60_Human | 1.09395221 |
| 67 | IRF8_22096565_ChIP-ChIP_GC-B_Human | 1.09247587 |
| 68 | SMRT_22465074_ChIP-Seq_MACROPHAGES_Mouse | 1.08047534 |
| 69 | BCAT_22108803_ChIP-Seq_LS180_Human | 1.06830168 |
| 70 | RUNX_20019798_ChIP-Seq_JUKART_Human | 1.06237520 |
| 71 | TAL1_20887958_ChIP-Seq_HPC-7_Mouse | 1.04954182 |
| 72 | STAT1_20625510_ChIP-Seq_HELA_Human | 1.04858245 |
| 73 | GATA3_26560356_Chip-Seq_TH2_Human | 1.04441861 |
| 74 | NRF2_20460467_ChIP-Seq_MEFs_Mouse | 1.03353844 |
| 75 | NFE2L2_20460467_ChIP-Seq_MEFs_Mouse | 1.03353844 |
| 76 | CTCF_21964334_ChIP-Seq_BJAB-B_Human | 1.01266314 |
| 77 | MAF_26560356_Chip-Seq_TH1_Human | 1.00715951 |
| 78 | FLI1_21571218_ChIP-Seq_MEGAKARYOCYTES_Human | 1.00001798 |
| 79 | STAT3_22323479_ChIP-Seq_MACROPHAGE_Mouse | 0.99148685 |
| 80 | BCL6_27268052_Chip-Seq_Bcells_Human | 0.98881465 |
| 81 | FOXA1_25329375_ChIP-Seq_VCAP_Human | 0.96059133 |
| 82 | FOXA1_27270436_Chip-Seq_PROSTATE_Human | 0.96059133 |
| 83 | PBX1_22567123_ChIP-ChIP_OVCAR3_Human | 0.95935809 |
| 84 | IRF8_27001747_Chip-Seq_BMDM_Mouse | 0.94541028 |
| 85 | NCOR1_26117541_ChIP-Seq_K562_Human | 0.93741007 |
| 86 | BCOR_27268052_Chip-Seq_Bcells_Human | 0.92361531 |
| 87 | PPARG_20176806_ChIP-Seq_MACROPHAGES_Mouse | 0.91865309 |
| 88 | PBX_27287812_Chip-Seq_EMBYONIC-LIMB_Mouse | 0.90985741 |
| 89 | MYB_26560356_Chip-Seq_TH2_Human | 0.89625107 |
| 90 | UBF1/2_26484160_Chip-Seq_FIBROBLAST_Human | 0.89009355 |
| 91 | VDR_23401126_ChIP-Seq_LCL-AND-THP1_Human | 0.88902568 |
| 92 | TAF2_19829295_ChIP-Seq_ESCs_Human | 0.88563049 |
| 93 | NANOG_19829295_ChIP-Seq_ESCs_Human | 0.88255076 |
| 94 | SOX2_19829295_ChIP-Seq_ESCs_Human | 0.88255076 |
| 95 | RUNX1_17652178_ChIP-ChIP_JURKAT_Human | 0.88039587 |
| 96 | TCF3/E2A_22897851_ChIP-Seq_JUKARTE6-1_Human | 0.88020393 |
| 97 | VDR_24787735_ChIP-Seq_THP-1_Human | 0.87233608 |
| 98 | OCT1_27270436_Chip-Seq_PROSTATE_Human | 0.85740613 |
| 99 | ESR1_20079471_ChIP-ChIP_T-47D_Human | 0.85733500 |
| 100 | CEBPB_22108803_ChIP-Seq_LS180_Human | 0.85601301 |

| Rank | Gene Set | Z-score |
|---|---|---|
| 1 | MP0005464_abnormal_platelet_physiology | 8.78464520 |
| 2 | MP0005084_abnormal_gallbladder_morpholo | 3.92217778 |
| 3 | MP0008004_abnormal_stomach_pH | 3.69654594 |
| 4 | MP0000465_gastrointestinal_hemorrhage | 3.58315377 |
| 5 | MP0003303_peritoneal_inflammation | 3.50039034 |
| 6 | MP0003724_increased_susceptibility_to | 2.99314299 |
| 7 | MP0002102_abnormal_ear_morphology | 2.64576341 |
| 8 | MP0005167_abnormal_blood-brain_barrier | 2.18573596 |
| 9 | MP0000015_abnormal_ear_pigmentation | 2.15068081 |
| 10 | MP0005083_abnormal_biliary_tract | 2.12429496 |
| 11 | MP0005410_abnormal_fertilization | 2.07441600 |
| 12 | MP0005174_abnormal_tail_pigmentation | 2.01060634 |
| 13 | MP0002653_abnormal_ependyma_morphology | 2.01024809 |
| 14 | MP0005397_hematopoietic_system_phenotyp | 1.95866268 |
| 15 | MP0001545_abnormal_hematopoietic_system | 1.95866268 |
| 16 | MP0001835_abnormal_antigen_presentation | 1.94972262 |
| 17 | MP0004130_abnormal_muscle_cell | 1.93996491 |
| 18 | MP0001661_extended_life_span | 1.92522877 |
| 19 | MP0002736_abnormal_nociception_after | 1.89964434 |
| 20 | MP0009697_abnormal_copulation | 1.86025622 |
| 21 | MP0000230_abnormal_systemic_arterial | 1.83894841 |
| 22 | MP0001968_abnormal_touch/_nociception | 1.78317247 |
| 23 | MP0000343_altered_response_to | 1.64334255 |
| 24 | MP0001664_abnormal_digestion | 1.62304252 |
| 25 | MP0005646_abnormal_pituitary_gland | 1.60736672 |
| 26 | MP0010368_abnormal_lymphatic_system | 1.59849478 |
| 27 | MP0001188_hyperpigmentation | 1.57991800 |
| 28 | MP0003136_yellow_coat_color | 1.57129585 |
| 29 | MP0005377_hearing/vestibular/ear_phenot | 1.48938245 |
| 30 | MP0003878_abnormal_ear_physiology | 1.48938245 |
| 31 | MP0001663_abnormal_digestive_system | 1.45243855 |
| 32 | MP0008872_abnormal_physiological_respon | 1.45215254 |
| 33 | MP0004134_abnormal_chest_morphology | 1.44224126 |
| 34 | MP0002148_abnormal_hypersensitivity_rea | 1.38513452 |
| 35 | MP0004808_abnormal_hematopoietic_stem | 1.34341931 |
| 36 | MP0005075_abnormal_melanosome_morpholog | 1.32177324 |
| 37 | MP0005171_absent_coat_pigmentation | 1.28289293 |
| 38 | MP0002398_abnormal_bone_marrow | 1.26968910 |
| 39 | MP0001879_abnormal_lymphatic_vessel | 1.25370604 |
| 40 | MP0005409_darkened_coat_color | 1.24795803 |
| 41 | MP0003638_abnormal_response/metabolism_ | 1.23881170 |
| 42 | MP0004084_abnormal_cardiac_muscle | 1.19389986 |
| 43 | MP0001851_eye_inflammation | 1.14249970 |
| 44 | MP0009278_abnormal_bone_marrow | 1.12980685 |
| 45 | MP0000383_abnormal_hair_follicle | 1.11883373 |
| 46 | MP0010155_abnormal_intestine_physiology | 1.11265140 |
| 47 | MP0003656_abnormal_erythrocyte_physiolo | 1.09979055 |
| 48 | MP0003828_pulmonary_edema | 1.08864291 |
| 49 | MP0004147_increased_porphyrin_level | 1.08859667 |
| 50 | MP0002733_abnormal_thermal_nociception | 1.06654391 |
| 51 | MP0004381_abnormal_hair_follicle | 1.04019591 |
| 52 | MP0002132_abnormal_respiratory_system | 1.03383377 |
| 53 | MP0006276_abnormal_autonomic_nervous | 1.02225338 |
| 54 | MP0005535_abnormal_body_temperature | 1.01978654 |
| 55 | MP0001765_abnormal_ion_homeostasis | 1.01780693 |
| 56 | MP0010329_abnormal_lipoprotein_level | 0.97488286 |
| 57 | MP0002735_abnormal_chemical_nociception | 0.97047992 |
| 58 | MP0000249_abnormal_blood_vessel | 0.96834055 |
| 59 | MP0008775_abnormal_heart_ventricle | 0.95030305 |
| 60 | MP0000689_abnormal_spleen_morphology | 0.94633947 |
| 61 | MP0005666_abnormal_adipose_tissue | 0.93528556 |
| 62 | MP0005000_abnormal_immune_tolerance | 0.90375599 |
| 63 | MP0005381_digestive/alimentary_phenotyp | 0.89078281 |
| 64 | MP0006292_abnormal_olfactory_placode | 0.88953594 |
| 65 | MP0005501_abnormal_skin_physiology | 0.87729389 |
| 66 | MP0002429_abnormal_blood_cell | 0.87191179 |
| 67 | MP0005671_abnormal_response_to | 0.85964085 |
| 68 | MP0003763_abnormal_thymus_physiology | 0.85832815 |
| 69 | MP0002876_abnormal_thyroid_physiology | 0.85736904 |
| 70 | MP0009333_abnormal_splenocyte_physiolog | 0.84607800 |
| 71 | MP0004185_abnormal_adipocyte_glucose | 0.84398800 |
| 72 | MP0004510_myositis | 0.84151018 |
| 73 | MP0008875_abnormal_xenobiotic_pharmacok | 0.83661197 |
| 74 | MP0002160_abnormal_reproductive_system | 0.83120864 |
| 75 | MP0008874_decreased_physiological_sensi | 0.79180148 |
| 76 | MP0005551_abnormal_eye_electrophysiolog | 0.78879327 |
| 77 | MP0010386_abnormal_urinary_bladder | 0.78247700 |
| 78 | MP0009642_abnormal_blood_homeostasis | 0.77285288 |
| 79 | MP0001986_abnormal_taste_sensitivity | 0.77186137 |
| 80 | MP0001756_abnormal_urination | 0.76078544 |
| 81 | MP0002722_abnormal_immune_system | 0.75018609 |
| 82 | MP0000490_abnormal_crypts_of | 0.74552215 |
| 83 | MP0004215_abnormal_myocardial_fiber | 0.74390737 |
| 84 | MP0002723_abnormal_immune_serum | 0.74349883 |
| 85 | MP0008569_lethality_at_weaning | 0.74128350 |
| 86 | MP0006036_abnormal_mitochondrial_physio | 0.73867803 |
| 87 | MP0003879_abnormal_hair_cell | 0.72566710 |
| 88 | MP0003011_delayed_dark_adaptation | 0.72078191 |
| 89 | MP0003183_abnormal_peptide_metabolism | 0.70464697 |
| 90 | MP0003566_abnormal_cell_adhesion | 0.68961744 |
| 91 | MP0000716_abnormal_immune_system | 0.68726678 |
| 92 | MP0003718_maternal_effect | 0.67998822 |
| 93 | MP0001970_abnormal_pain_threshold | 0.67447920 |
| 94 | MP0000372_irregular_coat_pigmentation | 0.65220919 |
| 95 | MP0003698_abnormal_male_reproductive | 0.62820624 |
| 96 | MP0001800_abnormal_humoral_immune | 0.62408190 |
| 97 | MP0000681_abnormal_thyroid_gland | 0.62023228 |
| 98 | MP0002452_abnormal_antigen_presenting | 0.61595980 |
| 99 | MP0002118_abnormal_lipid_homeostasis | 0.60676320 |
| 100 | MP0002420_abnormal_adaptive_immunity | 0.60350581 |

| Rank | Gene Set | Z-score |
|---|---|---|
| 1 | Petechiae (HP:0000967) | 8.21860534 |
| 2 | Menorrhagia (HP:0000132) | 8.14940519 |
| 3 | Increased mean platelet volume (HP:0011877) | 8.09297765 |
| 4 | Abnormal platelet volume (HP:0011876) | 7.67020981 |
| 5 | Purpura (HP:0000979) | 7.13271671 |
| 6 | Epistaxis (HP:0000421) | 6.77759830 |
| 7 | Hyperlipoproteinemia (HP:0010980) | 5.39110505 |
| 8 | Gingival bleeding (HP:0000225) | 5.19267775 |
| 9 | Abnormal platelet function (HP:0011869) | 5.03678772 |
| 10 | Impaired platelet aggregation (HP:0003540) | 5.03678772 |
| 11 | Dyschromatopsia (HP:0007641) | 4.93404766 |
| 12 | Renal Fanconi syndrome (HP:0001994) | 4.45300999 |
| 13 | Decreased central vision (HP:0007663) | 4.27829045 |
| 14 | Absent rod-and cone-mediated responses on ERG (HP:0007688) | 3.93907830 |
| 15 | Attenuation of retinal blood vessels (HP:0007843) | 3.77153141 |
| 16 | Poikilocytosis (HP:0004447) | 3.67316236 |
| 17 | Exertional dyspnea (HP:0002875) | 3.60268878 |
| 18 | Acanthocytosis (HP:0001927) | 3.59048659 |
| 19 | Papillary thyroid carcinoma (HP:0002895) | 3.56169015 |
| 20 | Increased hepatocellular lipid droplets (HP:0006565) | 3.50673739 |
| 21 | Lipid accumulation in hepatocytes (HP:0006561) | 3.14203728 |
| 22 | Abnormal pupillary function (HP:0007686) | 3.12675918 |
| 23 | Spontaneous hematomas (HP:0007420) | 3.06211132 |
| 24 | Abnormality of lateral ventricle (HP:0030047) | 2.90681267 |
| 25 | Bruising susceptibility (HP:0000978) | 2.88229517 |
| 26 | Joint hemorrhage (HP:0005261) | 2.85378382 |
| 27 | Abnormality of renal resorption (HP:0011038) | 2.83263000 |
| 28 | Abnormality of the common coagulation pathway (HP:0010990) | 2.79789967 |
| 29 | Conjunctival telangiectasia (HP:0000524) | 2.76734401 |
| 30 | Abnormal rod and cone electroretinograms (HP:0008323) | 2.62676229 |
| 31 | Paralysis (HP:0003470) | 2.61244844 |
| 32 | Abnormality of the heme biosynthetic pathway (HP:0010472) | 2.60745124 |
| 33 | Increased intramyocellular lipid droplets (HP:0012240) | 2.55266348 |
| 34 | Abnormal auditory evoked potentials (HP:0006958) | 2.48948714 |
| 35 | Back pain (HP:0003418) | 2.39448744 |
| 36 | Abnormality of the vasculature of the conjunctiva (HP:0008054) | 2.38779029 |
| 37 | Muscle abnormality related to mitochondrial dysfunction (HP:0003800) | 2.33567251 |
| 38 | Thyroid-stimulating hormone excess (HP:0002925) | 2.29037907 |
| 39 | Decreased activity of cytochrome C oxidase in muscle tissue (HP:0003688) | 2.24759665 |
| 40 | Thyroid carcinoma (HP:0002890) | 2.22433951 |
| 41 | Increased muscle lipid content (HP:0009058) | 2.21820005 |
| 42 | Respiratory difficulties (HP:0002880) | 2.16370575 |
| 43 | Dynein arm defect of respiratory motile cilia (HP:0012255) | 2.15230847 |
| 44 | Absent/shortened dynein arms (HP:0200106) | 2.15230847 |
| 45 | Hypophosphatemic rickets (HP:0004912) | 2.14130163 |
| 46 | Atonic seizures (HP:0010819) | 2.03921489 |
| 47 | Abnormal ciliary motility (HP:0012262) | 2.01700976 |
| 48 | Long clavicles (HP:0000890) | 2.00887300 |
| 49 | Prolonged bleeding time (HP:0003010) | 10.2056785 |
| 50 | Joint swelling (HP:0001386) | 1.95383373 |
| 51 | Metaphyseal dysplasia (HP:0100255) | 1.94329849 |
| 52 | Spontaneous abortion (HP:0005268) | 1.91542760 |
| 53 | Generalized aminoaciduria (HP:0002909) | 1.91099146 |
| 54 | Choroideremia (HP:0001139) | 1.90131981 |
| 55 | Hypomagnesemia (HP:0002917) | 1.86084080 |
| 56 | Male infertility (HP:0003251) | 1.84027453 |
| 57 | Febrile seizures (HP:0002373) | 1.83611948 |
| 58 | Facial diplegia (HP:0001349) | 1.82668280 |
| 59 | Decreased electroretinogram (ERG) amplitude (HP:0000654) | 1.80695750 |
| 60 | Acute lymphatic leukemia (HP:0006721) | 1.80364247 |
| 61 | Abnormality of the level of lipoprotein cholesterol (HP:0010979) | 1.79638164 |
| 62 | Abnormal respiratory motile cilium morphology (HP:0005938) | 1.78146718 |
| 63 | Abnormal respiratory epithelium morphology (HP:0012253) | 1.78146718 |
| 64 | Renal cortical cysts (HP:0000803) | 1.77779502 |
| 65 | Chronic otitis media (HP:0000389) | 1.76701036 |
| 66 | Abnormality of urine glucose concentration (HP:0011016) | 1.75088470 |
| 67 | Glycosuria (HP:0003076) | 1.75088470 |
| 68 | Muscle fiber atrophy (HP:0100295) | 1.74945286 |
| 69 | Hepatosplenomegaly (HP:0001433) | 1.73801003 |
| 70 | Increased density of long bones (HP:0006392) | 1.71608922 |
| 71 | Abnormality of iron homeostasis (HP:0011031) | 1.68964044 |
| 72 | Abnormality of the hepatic vasculature (HP:0006707) | 1.68094548 |
| 73 | Facial hemangioma (HP:0000329) | 1.67856171 |
| 74 | Type 2 muscle fiber atrophy (HP:0003554) | 1.66843324 |
| 75 | Renal tubular dysfunction (HP:0000124) | 1.65208832 |
| 76 | Thrombocytosis (HP:0001894) | 1.64333322 |
| 77 | Congenital stationary night blindness (HP:0007642) | 1.61444120 |
| 78 | Constricted visual fields (HP:0001133) | 1.60836309 |
| 79 | Abolished electroretinogram (ERG) (HP:0000550) | 1.59700316 |
| 80 | Elevated circulating parathyroid hormone (PTH) level (HP:0003165) | 1.57482105 |
| 81 | Rectovaginal fistula (HP:0000143) | 1.56603599 |
| 82 | Rectal fistula (HP:0100590) | 1.56603599 |
| 83 | Abnormality of transition element cation homeostasis (HP:0011030) | 1.55566407 |
| 84 | Hyperphosphaturia (HP:0003109) | 1.55197268 |
| 85 | Pendular nystagmus (HP:0012043) | 1.52930359 |
| 86 | Abnormality of the costochondral junction (HP:0000919) | 1.52274719 |
| 87 | Xanthomatosis (HP:0000991) | 1.52145707 |
| 88 | Autoimmune hemolytic anemia (HP:0001890) | 1.50913476 |
| 89 | Arterial thrombosis (HP:0004420) | 1.50726395 |
| 90 | Stomatitis (HP:0010280) | 1.50462361 |
| 91 | Genetic anticipation (HP:0003743) | 1.50224440 |
| 92 | Abnormal urine phosphate concentration (HP:0012599) | 1.47887694 |
| 93 | Abnormality of alanine metabolism (HP:0010916) | 1.47674128 |
| 94 | Hyperalaninemia (HP:0003348) | 1.47674128 |
| 95 | Abnormality of pyruvate family amino acid metabolism (HP:0010915) | 1.47674128 |
| 96 | Portal hypertension (HP:0001409) | 1.47322612 |
| 97 | Increased IgM level (HP:0003496) | 1.46110187 |
| 98 | Abnormality of magnesium homeostasis (HP:0004921) | 1.44907881 |
| 99 | Failure to thrive in infancy (HP:0001531) | 1.44491159 |
| 100 | Hypertriglyceridemia (HP:0002155) | 1.42387049 |

| Rank | Gene Set | Z-score |
|---|---|---|
| 1 | MAP4K2 | 5.14466822 |
| 2 | MST4 | 3.84105515 |
| 3 | RIPK4 | 3.35925172 |
| 4 | BMX | 3.25605277 |
| 5 | NUAK1 | 2.94252296 |
| 6 | ACVR1B | 2.32509917 |
| 7 | BMPR2 | 2.24832218 |
| 8 | SYK | 2.13998617 |
| 9 | BTK | 2.13720248 |
| 10 | TAOK3 | 2.13483599 |
| 11 | TEC | 2.13439082 |
| 12 | MYLK | 2.08049532 |
| 13 | MAP2K3 | 2.06367805 |
| 14 | STK3 | 2.05697517 |
| 15 | PTK2B | 1.96330902 |
| 16 | CSF1R | 1.96070401 |
| 17 | ADRBK2 | 1.95558695 |
| 18 | GRK5 | 1.86921161 |
| 19 | ZAP70 | 1.85011105 |
| 20 | MATK | 1.74819386 |
| 21 | BRD4 | 1.70384481 |
| 22 | EIF2AK3 | 1.68348493 |
| 23 | GRK6 | 1.52918979 |
| 24 | TNIK | 1.49593652 |
| 25 | TXK | 1.49119464 |
| 26 | HCK | 1.38515404 |
| 27 | PIK3CG | 1.32971512 |
| 28 | TNK2 | 1.28641365 |
| 29 | MAPK15 | 1.28475151 |
| 30 | EIF2AK2 | 1.21742428 |
| 31 | BCKDK | 1.16368278 |
| 32 | IKBKB | 1.15362192 |
| 33 | EIF2AK1 | 1.13771110 |
| 34 | ADRBK1 | 1.09474693 |
| 35 | ILK | 1.07715443 |
| 36 | ZAK | 1.06415822 |
| 37 | WNK4 | 1.06218152 |
| 38 | LYN | 1.01071825 |
| 39 | MKNK1 | 1.00225599 |
| 40 | PRKCQ | 0.99482327 |
| 41 | PNCK | 0.99042501 |
| 42 | TAF1 | 0.97784315 |
| 43 | DAPK3 | 0.97011096 |
| 44 | MARK3 | 0.92377017 |
| 45 | FES | 0.92287302 |
| 46 | DAPK2 | 0.91744103 |
| 47 | PLK2 | 0.91057071 |
| 48 | FLT3 | 0.81843106 |
| 49 | BLK | 0.79944067 |
| 50 | TLK1 | 0.78421231 |
| 51 | ERBB3 | 0.77794599 |
| 52 | PIM2 | 0.77570787 |
| 53 | MAPK12 | 0.75742536 |
| 54 | MAP4K1 | 0.75665067 |
| 55 | PAK1 | 0.73471386 |
| 56 | TESK2 | 0.73265988 |
| 57 | VRK1 | 0.72789799 |
| 58 | CCNB1 | 0.70452901 |
| 59 | PRKD1 | 0.69106292 |
| 60 | SMG1 | 0.66939646 |
| 61 | BMPR1B | 0.66549159 |
| 62 | TGFBR1 | 0.65472484 |
| 63 | MAP2K1 | 0.63467642 |
| 64 | PINK1 | 0.61575340 |
| 65 | VRK2 | 0.56689344 |
| 66 | IRAK1 | 0.53981654 |
| 67 | LCK | 0.53927573 |
| 68 | PKN1 | 0.52527672 |
| 69 | HIPK2 | 0.52348597 |
| 70 | KIT | 0.52346705 |
| 71 | LMTK2 | 0.52148718 |
| 72 | PDPK1 | 0.51485501 |
| 73 | MAPKAPK3 | 0.50543498 |
| 74 | PDK1 | 0.50408259 |
| 75 | PRKG1 | 0.48150671 |
| 76 | PHKG2 | 0.47143974 |
| 77 | PHKG1 | 0.47143974 |
| 78 | ARAF | 0.46656692 |
| 79 | ITK | 0.45231842 |
| 80 | FER | 0.45070132 |
| 81 | FGR | 0.44493239 |
| 82 | MUSK | 0.42999207 |
| 83 | MAPK13 | 0.42364727 |
| 84 | STK39 | 0.42198757 |
| 85 | DYRK3 | 0.42142632 |
| 86 | PRKCD | 0.40618490 |
| 87 | TAOK2 | 0.40318548 |
| 88 | MAP3K5 | 0.39581377 |
| 89 | MAP3K14 | 0.38392777 |
| 90 | GRK1 | 0.37910155 |
| 91 | TRIM28 | 0.37574602 |
| 92 | EPHB2 | 0.36905073 |
| 93 | STK4 | 0.36901323 |
| 94 | RET | 0.35617893 |
| 95 | CDK9 | 0.35175590 |
| 96 | BRSK2 | 0.33723974 |
| 97 | CAMKK2 | 0.33360834 |
| 98 | EPHA3 | 0.32542312 |
| 99 | RPS6KA5 | 0.32277888 |
| 100 | MINK1 | 0.32184546 |

| Rank | Gene Set | Z-score |
|---|---|---|
| 1 | Platelet activation_Homo sapiens_hsa04611 | 4.95323988 |
| 2 | alpha-Linolenic acid metabolism_Homo sapiens_hsa00592 | 3.02076213 |
| 3 | Glycosphingolipid biosynthesis - lacto and neolacto series_Homo sapiens_hsa00601 | 2.97470517 |
| 4 | SNARE interactions in vesicular transport_Homo sapiens_hsa04130 | 2.85908984 |
| 5 | Arachidonic acid metabolism_Homo sapiens_hsa00590 | 2.75678392 |
| 6 | Nicotinate and nicotinamide metabolism_Homo sapiens_hsa00760 | 2.67234665 |
| 7 | Linoleic acid metabolism_Homo sapiens_hsa00591 | 2.54234766 |
| 8 | Ubiquinone and other terpenoid-quinone biosynthesis_Homo sapiens_hsa00130 | 2.26579168 |
| 9 | Serotonergic synapse_Homo sapiens_hsa04726 | 2.13167938 |
| 10 | Hematopoietic cell lineage_Homo sapiens_hsa04640 | 2.02353267 |
| 11 | Vascular smooth muscle contraction_Homo sapiens_hsa04270 | 1.93663706 |
| 12 | Nitrogen metabolism_Homo sapiens_hsa00910 | 1.91905816 |
| 13 | Gap junction_Homo sapiens_hsa04540 | 1.83040598 |
| 14 | Sulfur metabolism_Homo sapiens_hsa00920 | 1.75690800 |
| 15 | Glycosaminoglycan biosynthesis - keratan sulfate_Homo sapiens_hsa00533 | 1.68090110 |
| 16 | Pathogenic Escherichia coli infection_Homo sapiens_hsa05130 | 1.64107843 |
| 17 | Sulfur relay system_Homo sapiens_hsa04122 | 1.60833124 |
| 18 | Long-term depression_Homo sapiens_hsa04730 | 1.59962225 |
| 19 | Alcoholism_Homo sapiens_hsa05034 | 1.59254056 |
| 20 | Phototransduction_Homo sapiens_hsa04744 | 1.46183807 |
| 21 | Systemic lupus erythematosus_Homo sapiens_hsa05322 | 1.45767652 |
| 22 | Glutathione metabolism_Homo sapiens_hsa00480 | 1.45630951 |
| 23 | ECM-receptor interaction_Homo sapiens_hsa04512 | 1.39967368 |
| 24 | Steroid hormone biosynthesis_Homo sapiens_hsa00140 | 1.35954750 |
| 25 | Glycosaminoglycan degradation_Homo sapiens_hsa00531 | 1.31095066 |
| 26 | Pancreatic secretion_Homo sapiens_hsa04972 | 1.27508130 |
| 27 | Glycerolipid metabolism_Homo sapiens_hsa00561 | 1.24284590 |
| 28 | Olfactory transduction_Homo sapiens_hsa04740 | 1.23483869 |
| 29 | Circadian entrainment_Homo sapiens_hsa04713 | 1.23190098 |
| 30 | Fatty acid elongation_Homo sapiens_hsa00062 | 1.18156044 |
| 31 | Glycerophospholipid metabolism_Homo sapiens_hsa00564 | 1.18135677 |
| 32 | Drug metabolism - cytochrome P450_Homo sapiens_hsa00982 | 1.13797697 |
| 33 | Chemokine signaling pathway_Homo sapiens_hsa04062 | 1.12289798 |
| 34 | Neuroactive ligand-receptor interaction_Homo sapiens_hsa04080 | 1.11504877 |
| 35 | Pantothenate and CoA biosynthesis_Homo sapiens_hsa00770 | 1.11282365 |
| 36 | Taste transduction_Homo sapiens_hsa04742 | 1.08369305 |
| 37 | Metabolism of xenobiotics by cytochrome P450_Homo sapiens_hsa00980 | 1.06979242 |
| 38 | Salivary secretion_Homo sapiens_hsa04970 | 1.00979167 |
| 39 | Inflammatory mediator regulation of TRP channels_Homo sapiens_hsa04750 | 0.95479203 |
| 40 | Fat digestion and absorption_Homo sapiens_hsa04975 | 0.91955206 |
| 41 | Calcium signaling pathway_Homo sapiens_hsa04020 | 0.90954159 |
| 42 | Ether lipid metabolism_Homo sapiens_hsa00565 | 0.90164587 |
| 43 | Chemical carcinogenesis_Homo sapiens_hsa05204 | 0.89163225 |
| 44 | Collecting duct acid secretion_Homo sapiens_hsa04966 | 0.87807099 |
| 45 | Endocytosis_Homo sapiens_hsa04144 | 0.86591013 |
| 46 | Primary bile acid biosynthesis_Homo sapiens_hsa00120 | 0.84713447 |
| 47 | Renin secretion_Homo sapiens_hsa04924 | 0.83613155 |
| 48 | Morphine addiction_Homo sapiens_hsa05032 | 0.80856877 |
| 49 | B cell receptor signaling pathway_Homo sapiens_hsa04662 | 0.74237392 |
| 50 | Phospholipase D signaling pathway_Homo sapiens_hsa04072 | 0.71806362 |
| 51 | Sphingolipid metabolism_Homo sapiens_hsa00600 | 0.70940150 |
| 52 | Primary immunodeficiency_Homo sapiens_hsa05340 | 0.69502258 |
| 53 | Retrograde endocannabinoid signaling_Homo sapiens_hsa04723 | 0.68626205 |
| 54 | Ovarian steroidogenesis_Homo sapiens_hsa04913 | 0.68186065 |
| 55 | Cytosolic DNA-sensing pathway_Homo sapiens_hsa04623 | 0.67701204 |
| 56 | Transcriptional misregulation in cancer_Homo sapiens_hsa05202 | 0.67505666 |
| 57 | Regulation of lipolysis in adipocytes_Homo sapiens_hsa04923 | 0.65668571 |
| 58 | African trypanosomiasis_Homo sapiens_hsa05143 | 0.62559432 |
| 59 | Fc epsilon RI signaling pathway_Homo sapiens_hsa04664 | 0.62058827 |
| 60 | Phosphatidylinositol signaling system_Homo sapiens_hsa04070 | 0.61212927 |
| 61 | Retinol metabolism_Homo sapiens_hsa00830 | 0.59714396 |
| 62 | ABC transporters_Homo sapiens_hsa02010 | 0.58735993 |
| 63 | Glycosphingolipid biosynthesis - globo series_Homo sapiens_hsa00603 | 0.58017727 |
| 64 | Regulation of actin cytoskeleton_Homo sapiens_hsa04810 | 0.57777769 |
| 65 | Renin-angiotensin system_Homo sapiens_hsa04614 | 0.56388197 |
| 66 | Glycosphingolipid biosynthesis - ganglio series_Homo sapiens_hsa00604 | 0.55971998 |
| 67 | Cysteine and methionine metabolism_Homo sapiens_hsa00270 | 0.55479459 |
| 68 | Glycosylphosphatidylinositol(GPI)-anchor biosynthesis_Homo sapiens_hsa00563 | 0.54364226 |
| 69 | Cytokine-cytokine receptor interaction_Homo sapiens_hsa04060 | 0.51961949 |
| 70 | NOD-like receptor signaling pathway_Homo sapiens_hsa04621 | 0.51538574 |
| 71 | Cholinergic synapse_Homo sapiens_hsa04725 | 0.50583585 |
| 72 | Glutamatergic synapse_Homo sapiens_hsa04724 | 0.50568490 |
| 73 | Viral carcinogenesis_Homo sapiens_hsa05203 | 0.49497206 |
| 74 | Bacterial invasion of epithelial cells_Homo sapiens_hsa05100 | 0.48852940 |
| 75 | T cell receptor signaling pathway_Homo sapiens_hsa04660 | 0.48211560 |
| 76 | Shigellosis_Homo sapiens_hsa05131 | 0.47588167 |
| 77 | Pentose and glucuronate interconversions_Homo sapiens_hsa00040 | 0.47502454 |
| 78 | Cell adhesion molecules (CAMs)_Homo sapiens_hsa04514 | 0.46391488 |
| 79 | beta-Alanine metabolism_Homo sapiens_hsa00410 | 0.46091149 |
| 80 | Fc gamma R-mediated phagocytosis_Homo sapiens_hsa04666 | 0.45033395 |
| 81 | Drug metabolism - other enzymes_Homo sapiens_hsa00983 | 0.43795847 |
| 82 | Amyotrophic lateral sclerosis (ALS)_Homo sapiens_hsa05014 | 0.41660612 |
| 83 | Choline metabolism in cancer_Homo sapiens_hsa05231 | 0.41233167 |
| 84 | cGMP-PKG signaling pathway_Homo sapiens_hsa04022 | 0.40240588 |
| 85 | Malaria_Homo sapiens_hsa05144 | 0.39808448 |
| 86 | Peroxisome_Homo sapiens_hsa04146 | 0.39239532 |
| 87 | Gastric acid secretion_Homo sapiens_hsa04971 | 0.37928009 |
| 88 | GABAergic synapse_Homo sapiens_hsa04727 | 0.37629405 |
| 89 | Melanoma_Homo sapiens_hsa05218 | 0.37055978 |
| 90 | Starch and sucrose metabolism_Homo sapiens_hsa00500 | 0.36094750 |
| 91 | Purine metabolism_Homo sapiens_hsa00230 | 0.36072173 |
| 92 | Ascorbate and aldarate metabolism_Homo sapiens_hsa00053 | 0.35570807 |
| 93 | Dopaminergic synapse_Homo sapiens_hsa04728 | 0.34902958 |
| 94 | Oxytocin signaling pathway_Homo sapiens_hsa04921 | 0.34680571 |
| 95 | Rap1 signaling pathway_Homo sapiens_hsa04015 | 0.30324814 |
| 96 | Adipocytokine signaling pathway_Homo sapiens_hsa04920 | 0.29171436 |
| 97 | Vasopressin-regulated water reabsorption_Homo sapiens_hsa04962 | 0.28575361 |
| 98 | Inositol phosphate metabolism_Homo sapiens_hsa00562 | 0.27847091 |
| 99 | Ras signaling pathway_Homo sapiens_hsa04014 | 0.25257963 |
| 100 | Lysosome_Homo sapiens_hsa04142 | 0.24313839 |