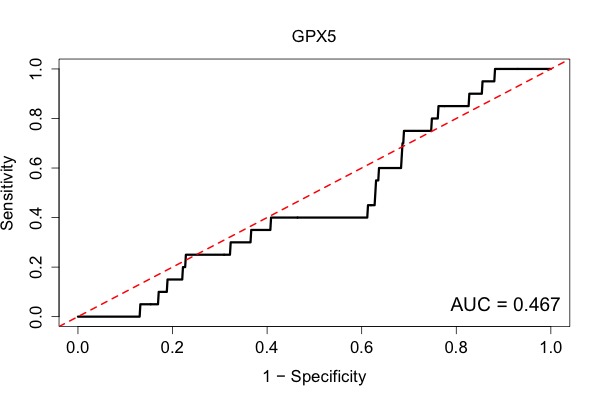
| Rank | Gene Set | Z-score |
|---|---|---|
| 1 | regulation of chronic inflammatory response (GO:0002676) | 9.09665966 |
| 2 | single fertilization (GO:0007338) | 8.60292132 |
| 3 | indole-containing compound catabolic process (GO:0042436) | 8.57867698 |
| 4 | indolalkylamine catabolic process (GO:0046218) | 8.57867698 |
| 5 | tryptophan catabolic process (GO:0006569) | 8.57867698 |
| 6 | heterotypic cell-cell adhesion (GO:0034113) | 8.54034023 |
| 7 | positive regulation of type 2 immune response (GO:0002830) | 7.45082099 |
| 8 | tryptophan metabolic process (GO:0006568) | 7.37489141 |
| 9 | negative regulation of interleukin-10 production (GO:0032693) | 7.36545838 |
| 10 | aromatic amino acid family catabolic process (GO:0009074) | 5.88510561 |
| 11 | fertilization (GO:0009566) | 5.67490275 |
| 12 | amine catabolic process (GO:0009310) | 5.52318649 |
| 13 | cellular biogenic amine catabolic process (GO:0042402) | 5.52318649 |
| 14 | indolalkylamine metabolic process (GO:0006586) | 5.41793661 |
| 15 | negative regulation of interleukin-8 production (GO:0032717) | 5.24932900 |
| 16 | benzene-containing compound metabolic process (GO:0042537) | 4.83101880 |
| 17 | digestion (GO:0007586) | 4.62921570 |
| 18 | epithelial cell morphogenesis (GO:0003382) | 4.37993970 |
| 19 | negative regulation of T cell apoptotic process (GO:0070233) | 4.37316455 |
| 20 | negative regulation of endopeptidase activity (GO:0010951) | 4.35105245 |
| 21 | positive regulation of cell-cell adhesion (GO:0022409) | 4.32025335 |
| 22 | aromatic amino acid family metabolic process (GO:0009072) | 4.25999863 |
| 23 | negative regulation of peptidase activity (GO:0010466) | 4.15343500 |
| 24 | transepithelial transport (GO:0070633) | 3.96823747 |
| 25 | regulation of type 2 immune response (GO:0002828) | 3.88535883 |
| 26 | indole-containing compound metabolic process (GO:0042430) | 3.87698190 |
| 27 | regulation of clathrin-mediated endocytosis (GO:2000369) | 3.78040420 |
| 28 | reverse cholesterol transport (GO:0043691) | 3.70076814 |
| 29 | sulfur amino acid catabolic process (GO:0000098) | 3.60188755 |
| 30 | defense response to bacterium (GO:0042742) | 3.53754504 |
| 31 | N-acetylneuraminate metabolic process (GO:0006054) | 3.41136928 |
| 32 | negative regulation of protein autophosphorylation (GO:0031953) | 3.34330332 |
| 33 | negative regulation of amyloid precursor protein catabolic process (GO:1902992) | 3.31762475 |
| 34 | phospholipid homeostasis (GO:0055091) | 3.22892448 |
| 35 | alpha-linolenic acid metabolic process (GO:0036109) | 3.13407905 |
| 36 | fatty acid beta-oxidation using acyl-CoA oxidase (GO:0033540) | 3.11227138 |
| 37 | response to bacterium (GO:0009617) | 3.05829780 |
| 38 | regulation of macrophage activation (GO:0043030) | 3.01322694 |
| 39 | seminiferous tubule development (GO:0072520) | 25.0875312 |
| 40 | regulation of lipoprotein metabolic process (GO:0050746) | 2.98785132 |
| 41 | negative regulation of proteolysis (GO:0045861) | 2.80924782 |
| 42 | glial cell proliferation (GO:0014009) | 2.80260632 |
| 43 | cysteine metabolic process (GO:0006534) | 2.76711354 |
| 44 | regulation of beta-amyloid formation (GO:1902003) | 2.73965910 |
| 45 | sialylation (GO:0097503) | 2.72698915 |
| 46 | complement activation, alternative pathway (GO:0006957) | 2.72107807 |
| 47 | regulation of activated T cell proliferation (GO:0046006) | 2.72005098 |
| 48 | negative regulation of glycogen biosynthetic process (GO:0045719) | 2.72004490 |
| 49 | negative regulation of protein processing (GO:0010955) | 2.70975262 |
| 50 | negative regulation of protein maturation (GO:1903318) | 2.70975262 |
| 51 | O-glycan processing (GO:0016266) | 2.69127505 |
| 52 | high-density lipoprotein particle remodeling (GO:0034375) | 2.67445208 |
| 53 | negative regulation of lymphocyte apoptotic process (GO:0070229) | 2.67216364 |
| 54 | positive regulation of cellular amide metabolic process (GO:0034250) | 2.64018843 |
| 55 | low-density lipoprotein particle clearance (GO:0034383) | 2.57990685 |
| 56 | positive regulation of interleukin-12 production (GO:0032735) | 2.55306815 |
| 57 | columnar/cuboidal epithelial cell development (GO:0002066) | 2.52617413 |
| 58 | hormone catabolic process (GO:0042447) | 2.52163067 |
| 59 | negative regulation of hydrolase activity (GO:0051346) | 2.51984349 |
| 60 | negative regulation of receptor-mediated endocytosis (GO:0048261) | 2.48172614 |
| 61 | regulation of amyloid precursor protein catabolic process (GO:1902991) | 2.47313654 |
| 62 | negative regulation of glycogen metabolic process (GO:0070874) | 2.46400829 |
| 63 | L-serine transport (GO:0015825) | 2.37006334 |
| 64 | alpha-amino acid catabolic process (GO:1901606) | 2.33743633 |
| 65 | valine metabolic process (GO:0006573) | 2.33420665 |
| 66 | regulation of endopeptidase activity (GO:0052548) | 2.32994037 |
| 67 | lipid catabolic process (GO:0016042) | 2.31486458 |
| 68 | pyrimidine ribonucleoside catabolic process (GO:0046133) | 2.30345740 |
| 69 | cellular amino acid catabolic process (GO:0009063) | 2.26106048 |
| 70 | negative regulation of interleukin-6 production (GO:0032715) | 2.25215620 |
| 71 | triglyceride catabolic process (GO:0019433) | 2.24675130 |
| 72 | response to misfolded protein (GO:0051788) | 2.23661586 |
| 73 | regulation of T cell apoptotic process (GO:0070232) | 2.22307992 |
| 74 | L-phenylalanine catabolic process (GO:0006559) | 2.22246236 |
| 75 | erythrose 4-phosphate/phosphoenolpyruvate family amino acid catabolic process (GO:1902222) | 2.22246236 |
| 76 | regulation of peptidase activity (GO:0052547) | 2.21376585 |
| 77 | acylglycerol catabolic process (GO:0046464) | 2.18529586 |
| 78 | neutral lipid catabolic process (GO:0046461) | 2.18529586 |
| 79 | protein-lipid complex remodeling (GO:0034368) | 2.15931124 |
| 80 | macromolecular complex remodeling (GO:0034367) | 2.15931124 |
| 81 | plasma lipoprotein particle remodeling (GO:0034369) | 2.15931124 |
| 82 | positive regulation of sterol transport (GO:0032373) | 2.10888588 |
| 83 | positive regulation of cholesterol transport (GO:0032376) | 2.10888588 |
| 84 | Golgi transport vesicle coating (GO:0048200) | 2.10369367 |
| 85 | COPI coating of Golgi vesicle (GO:0048205) | 2.10369367 |
| 86 | regulation of interleukin-10 production (GO:0032653) | 2.09270429 |
| 87 | cellular modified amino acid catabolic process (GO:0042219) | 2.08064498 |
| 88 | myelin maintenance (GO:0043217) | 2.07579679 |
| 89 | cellular response to epidermal growth factor stimulus (GO:0071364) | 2.07260142 |
| 90 | glutamate metabolic process (GO:0006536) | 2.06998377 |
| 91 | negative regulation of T cell proliferation (GO:0042130) | 2.05295502 |
| 92 | serine transport (GO:0032329) | 2.04926382 |
| 93 | activation of protein kinase A activity (GO:0034199) | 2.03779174 |
| 94 | regulation of reproductive process (GO:2000241) | 2.00083701 |
| 95 | regulation of T cell tolerance induction (GO:0002664) | 14.3540839 |
| 96 | production of molecular mediator involved in inflammatory response (GO:0002532) | 14.3463474 |
| 97 | positive regulation of tolerance induction (GO:0002645) | 12.3123729 |
| 98 | sperm capacitation (GO:0048240) | 11.1635125 |
| 99 | regulation of tolerance induction (GO:0002643) | 10.7156735 |
| 100 | kynurenine metabolic process (GO:0070189) | 10.4825669 |

| Rank | Gene Set | Z-score |
|---|---|---|
| 1 | MYCN_19997598_ChIP-ChIP_NEUROBLASTOMA_Human | 4.74864766 |
| 2 | CIITA_18437201_ChIP-ChIP_Raji_B_and_iDC_Human | 4.19847524 |
| 3 | IKZF1_21737484_ChIP-ChIP_HCT116_Human | 4.02533766 |
| 4 | AR_21572438_ChIP-Seq_LNCaP_Human | 3.21169130 |
| 5 | PPARG_19300518_ChIP-PET_3T3-L1_Mouse | 3.15477988 |
| 6 | CTNNB1_20615089_ChIP-ChIP_FETAL_BRAIN_Human | 2.63748077 |
| 7 | FLI1_27457419_Chip-Seq_LIVER_Mouse | 2.59990859 |
| 8 | ZFP322A_24550733_ChIP-Seq_MESCs_Mouse | 2.58766548 |
| 9 | ESR1_21235772_ChIP-Seq_MCF-7_Human | 2.54364141 |
| 10 | ZNF263_19887448_ChIP-Seq_K562_Human | 2.50798916 |
| 11 | ESR1_17901129_ChIP-ChIP_LIVER_Mouse | 2.45519226 |
| 12 | RXR_22158963_ChIP-Seq_LIVER_Mouse | 2.35697332 |
| 13 | LXR_22158963_ChIP-Seq_LIVER_Mouse | 2.32144071 |
| 14 | DNAJC2_21179169_ChIP-ChIP_NT2_Human | 2.19234983 |
| 15 | TRIM28_21343339_ChIP-Seq_HEK293_Human | 2.11085871 |
| 16 | ESR2_21235772_ChIP-Seq_MCF-7_Human | 2.06205383 |
| 17 | SOX9_25088423_ChIP-ChIP_EMBRYONIC_GONADS_Mouse | 2.05571174 |
| 18 | CLOCK_20551151_ChIP-Seq_293T_Human | 1.99591531 |
| 19 | PPARA_22158963_ChIP-Seq_LIVER_Mouse | 1.88959187 |
| 20 | GATA3_20176728_ChIP-ChIP_TSCs_Mouse | 1.84293346 |
| 21 | CTBP1_25329375_ChIP-Seq_LNCAP_Human | 1.79785954 |
| 22 | GATA3_21867929_ChIP-Seq_TH1_Mouse | 1.75234413 |
| 23 | PU.1_20176806_ChIP-Seq_MACROPHAGES_Mouse | 1.68138554 |
| 24 | NEUROD2_26341353_ChIP-Seq_CORTEX_Mouse | 1.67660148 |
| 25 | EGR1_23403033_ChIP-Seq_LIVER_Mouse | 1.67553093 |
| 26 | SMAD1_18555785_Chip-Seq_ESCs_Mouse | 1.63908577 |
| 27 | TET1_21451524_ChIP-Seq_MESCs_Mouse | 1.62802785 |
| 28 | REST_19997604_ChIP-ChIP_NEURONS_Mouse | 1.59024742 |
| 29 | PCGF2_27294783_Chip-Seq_ESCs_Mouse | 1.57309713 |
| 30 | CDX2_19796622_ChIP-Seq_MESCs_Mouse | 1.55869247 |
| 31 | FLI1_26923725_Chip-Seq_HEMOGENIC-ENDOTHELIUM_Mouse | 1.53120534 |
| 32 | SMAD4_21741376_ChIP-Seq_HESCs_Human | 1.52895519 |
| 33 | EZH2_18974828_ChIP-Seq_MESCs_Mouse | 1.52044333 |
| 34 | RNF2_18974828_ChIP-Seq_MESCs_Mouse | 1.52044333 |
| 35 | STAT1_17558387_ChIP-Seq_HELA_Human | 1.48252412 |
| 36 | RAD21_21589869_ChIP-Seq_MESCs_Mouse | 1.47988713 |
| 37 | FLI1_21867929_ChIP-Seq_CD8_Mouse | 1.47073668 |
| 38 | STAT3_22323479_ChIP-Seq_MACROPHAGE_Mouse | 1.46482983 |
| 39 | SOX2_22085726_ChIP-Seq_NPCs_Mouse | 1.44397159 |
| 40 | SUZ12_27294783_Chip-Seq_NPCs_Mouse | 1.39509305 |
| 41 | ESRRB_18555785_Chip-Seq_ESCs_Mouse | 1.38824423 |
| 42 | SRY_25088423_ChIP-ChIP_EMBRYONIC_GONADS_Mouse | 1.38444862 |
| 43 | SMAD3_21741376_ChIP-Seq_HESCs_Human | 1.34026903 |
| 44 | SMARCA4_20176728_ChIP-ChIP_TSCs_Mouse | 1.31596225 |
| 45 | TCF7L2_21901280_ChIP-Seq_H4IIE_Rat | 1.31505702 |
| 46 | ELF1_20517297_ChIP-Seq_JURKAT_Human | 1.29648558 |
| 47 | P68_20966046_ChIP-Seq_HELA_Human | 1.24054434 |
| 48 | CEBPB_26923725_Chip-Seq_MACROPHAGESS_Mouse | 1.23015074 |
| 49 | SUZ12_18692474_ChIP-Seq_MEFs_Mouse | 1.18299581 |
| 50 | RACK7_27058665_Chip-Seq_MCF-7_Human | 1.16732701 |
| 51 | VDR_24787735_ChIP-Seq_THP-1_Human | 1.16523053 |
| 52 | CTCF_18555785_Chip-Seq_ESCs_Mouse | 1.16480873 |
| 53 | SMC4_20622854_ChIP-Seq_HELA_Human | 1.15692730 |
| 54 | MYC_27129775_Chip-Seq_CORNEA_Mouse | 1.15580585 |
| 55 | JARID1B-DAIN_22020125_ChIP-Seq_ESCs_Mouse | 1.13334310 |
| 56 | SOX9_24532713_ChIP-Seq_HFSC_Mouse | 1.11736273 |
| 57 | PBX_27287812_Chip-Seq_EMBYONIC-LIMB_Mouse | 1.10546613 |
| 58 | TFAP2C_20629094_ChIP-Seq_MCF-7_Human | 1.10203608 |
| 59 | SALL4_22934838_ChIP-ChIP_CD34+_Human | 1.08347758 |
| 60 | BMI1_19503595_ChIP-Seq_MEFsC_Mouse | 1.06697646 |
| 61 | MYC_19915707_ChIP-ChIP_AK7_Human | 1.06326379 |
| 62 | NFE2_27457419_Chip-Seq_LIVER_Mouse | 1.05940548 |
| 63 | MTF2_20144788_ChIP-Seq_MESCs_Mouse | 1.05438384 |
| 64 | NR3C1_23031785_ChIP-Seq_PC12_Mouse | 1.04658584 |
| 65 | EGR1_20690147_ChIP-Seq_ERYTHROLEUKEMIA_Human | 1.03720864 |
| 66 | SUZ12_18555785_ChIP-Seq_MESCs_Mouse | 1.03174645 |
| 67 | FLI1_26923725_Chip-Seq_MACROPHAGESS_Mouse | 1.02685739 |
| 68 | CBX2_27304074_Chip-Seq_ESCs_Mouse | 1.00136102 |
| 69 | ELK4_26923725_Chip-Seq_MESODERM_Mouse | 0.99869246 |
| 70 | SREBP2_21459322_ChIP-Seq_LIVER_Mouse | 0.99230574 |
| 71 | SUZ12_18692474_ChIP-Seq_MESCs_Mouse | 0.99103393 |
| 72 | BCL6_27268052_Chip-Seq_Bcells_Human | 0.98371113 |
| 73 | FOXH1_21741376_ChIP-Seq_ESCs_Human | 0.98359192 |
| 74 | SUZ12_18974828_ChIP-Seq_MESCs_Mouse | 0.97994190 |
| 75 | DROSHA_22980978_ChIP-Seq_HELA_Human | 0.97198256 |
| 76 | TP53_20018659_ChIP-ChIP_R1E_Mouse | 0.95321730 |
| 77 | ZNF217_24962896_ChIP-Seq_MCF-7_Human | 0.94990695 |
| 78 | BACH1_22875853_ChIP-PCR_HELA_AND_SCP4_Human | 0.94380677 |
| 79 | NR1I2_20693526_ChIP-Seq_LIVER_Mouse | 0.93756567 |
| 80 | EZH2_27304074_Chip-Seq_ESCs_Mouse | 0.93657580 |
| 81 | KDM2B_26808549_Chip-Seq_REH_Human | 0.93542100 |
| 82 | SUZ12_20075857_ChIP-Seq_MESCs_Mouse | 0.93328460 |
| 83 | ERG_21242973_ChIP-ChIP_JURKAT_Human | 0.92611330 |
| 84 | KDM2B_26808549_Chip-Seq_K562_Human | 0.91310990 |
| 85 | LXR_22292898_ChIP-Seq_THP-1_Human | 0.91028361 |
| 86 | * GATA3_22897851_ChIP-Seq_JUKARTE6-1_Human | 0.89253065 |
| 87 | EZH2_27294783_Chip-Seq_NPCs_Mouse | 0.89088832 |
| 88 | PAX3-FKHR_20663909_ChIP-Seq_RHABDOMYOSARCOMA_Human | 0.88573044 |
| 89 | P300_27268052_Chip-Seq_Bcells_Human | 0.86999964 |
| 90 | GATA1_19941826_ChIP-Seq_K562_Human | 0.86768635 |
| 91 | SOX2_18555785_Chip-Seq_ESCs_Mouse | 0.86592048 |
| 92 | BCOR_27268052_Chip-Seq_Bcells_Human | 0.85513524 |
| 93 | SOX2_20726797_ChIP-Seq_SW620_Human | 0.84884436 |
| 94 | RAC3_21632823_ChIP-Seq_H3396_Human | 0.84469668 |
| 95 | WT1_20215353_ChIP-ChIP_NEPHRON_PROGENITOR_Mouse | 0.84098842 |
| 96 | WT1_19549856_ChIP-ChIP_CCG9911_Human | 0.81958416 |
| 97 | RUNX1_27457419_Chip-Seq_LIVER_Mouse | 0.80648051 |
| 98 | OCT4_20526341_ChIP-Seq_ESCs_Human | 0.80245342 |
| 99 | TEAD4_26923725_Chip-Seq_HEMANGIOBLAST_Mouse | 0.77694106 |
| 100 | POU5F1_26923725_Chip-Seq_MESODERM_Mouse | 0.77694106 |

| Rank | Gene Set | Z-score |
|---|---|---|
| 1 | MP0003303_peritoneal_inflammation | 5.72325437 |
| 2 | MP0003195_calcinosis | 5.17683526 |
| 3 | MP0002254_reproductive_system_inflammat | 4.95286395 |
| 4 | MP0004043_abnormal_pH_regulation | 4.69808874 |
| 5 | MP0010234_abnormal_vibrissa_follicle | 4.23175766 |
| 6 | MP0002139_abnormal_hepatobiliary_system | 4.20432971 |
| 7 | MP0005410_abnormal_fertilization | 3.30890894 |
| 8 | MP0005058_abnormal_lysosome_morphology | 3.17513206 |
| 9 | MP0003329_amyloid_beta_deposits | 3.05899385 |
| 10 | MP0000003_abnormal_adipose_tissue | 2.20224795 |
| 11 | MP0005360_urolithiasis | 2.18461216 |
| 12 | MP0000604_amyloidosis | 2.09335659 |
| 13 | MP0010329_abnormal_lipoprotein_level | 2.07283541 |
| 14 | MP0002168_other_aberrant_phenotype | 2.00408111 |
| 15 | MP0005365_abnormal_bile_salt | 1.85845427 |
| 16 | MP0003300_gastrointestinal_ulcer | 1.78528218 |
| 17 | MP0003566_abnormal_cell_adhesion | 1.77203663 |
| 18 | MP0004885_abnormal_endolymph | 1.67750223 |
| 19 | MP0001501_abnormal_sleep_pattern | 1.60524438 |
| 20 | MP0005085_abnormal_gallbladder_physiolo | 1.60073559 |
| 21 | MP0004130_abnormal_muscle_cell | 1.58001723 |
| 22 | MP0001765_abnormal_ion_homeostasis | 1.53476525 |
| 23 | MP0004859_abnormal_synaptic_plasticity | 1.53373992 |
| 24 | MP0005375_adipose_tissue_phenotype | 1.53362238 |
| 25 | MP0002837_dystrophic_cardiac_calcinosis | 1.53251558 |
| 26 | MP0001440_abnormal_grooming_behavior | 1.48122075 |
| 27 | MP0001853_heart_inflammation | 1.42919309 |
| 28 | MP0003690_abnormal_glial_cell | 1.39789019 |
| 29 | MP0000534_abnormal_ureter_morphology | 1.38162284 |
| 30 | MP0004858_abnormal_nervous_system | 1.35718114 |
| 31 | MP0009643_abnormal_urine_homeostasis | 1.35483491 |
| 32 | MP0003705_abnormal_hypodermis_morpholog | 1.33088537 |
| 33 | MP0005332_abnormal_amino_acid | 1.29543454 |
| 34 | MP0004185_abnormal_adipocyte_glucose | 1.29308500 |
| 35 | MP0005083_abnormal_biliary_tract | 1.27763903 |
| 36 | MP0008438_abnormal_cutaneous_collagen | 1.20484082 |
| 37 | MP0002118_abnormal_lipid_homeostasis | 1.19411226 |
| 38 | MP0002089_abnormal_postnatal_growth/wei | 1.17967912 |
| 39 | MP0005584_abnormal_enzyme/coenzyme_acti | 1.16352132 |
| 40 | MP0001756_abnormal_urination | 1.15186554 |
| 41 | MP0000537_abnormal_urethra_morphology | 1.14984982 |
| 42 | MP0005275_abnormal_skin_tensile | 1.11124793 |
| 43 | MP0002896_abnormal_bone_mineralization | 1.07446129 |
| 44 | MP0003806_abnormal_nucleotide_metabolis | 1.07073308 |
| 45 | MP0003191_abnormal_cellular_cholesterol | 1.06928559 |
| 46 | MP0004270_analgesia | 1.06272787 |
| 47 | MP0003252_abnormal_bile_duct | 1.06129428 |
| 48 | MP0002796_impaired_skin_barrier | 1.03991891 |
| 49 | MP0009780_abnormal_chondrocyte_physiolo | 1.01819529 |
| 50 | MP0005636_abnormal_mineral_homeostasis | 0.99476586 |
| 51 | MP0003075_altered_response_to | 0.97013743 |
| 52 | MP0008875_abnormal_xenobiotic_pharmacok | 0.96463906 |
| 53 | MP0002909_abnormal_adrenal_gland | 0.96172959 |
| 54 | MP0003632_abnormal_nervous_system | 0.95996406 |
| 55 | MP0005666_abnormal_adipose_tissue | 0.94592557 |
| 56 | MP0000920_abnormal_myelination | 0.93977565 |
| 57 | MP0003879_abnormal_hair_cell | 0.89078139 |
| 58 | MP0002733_abnormal_thermal_nociception | 0.85769269 |
| 59 | MP0002136_abnormal_kidney_physiology | 0.83663934 |
| 60 | MP0000747_muscle_weakness | 0.81427026 |
| 61 | MP0002933_joint_inflammation | 0.81185181 |
| 62 | MP0004145_abnormal_muscle_electrophysio | 0.80621241 |
| 63 | MP0000609_abnormal_liver_physiology | 0.78932079 |
| 64 | MP0003635_abnormal_synaptic_transmissio | 0.78667116 |
| 65 | MP0003631_nervous_system_phenotype | 0.77755633 |
| 66 | MP0004036_abnormal_muscle_relaxation | 0.77241435 |
| 67 | MP0002876_abnormal_thyroid_physiology | 0.76395791 |
| 68 | MP0003633_abnormal_nervous_system | 0.75724878 |
| 69 | MP0005319_abnormal_enzyme/_coenzyme | 0.72776009 |
| 70 | MP0002735_abnormal_chemical_nociception | 0.71985578 |
| 71 | MP0005395_other_phenotype | 0.69883651 |
| 72 | MP0005670_abnormal_white_adipose | 0.69485706 |
| 73 | MP0009840_abnormal_foam_cell | 0.68972049 |
| 74 | MP0005535_abnormal_body_temperature | 0.64843842 |
| 75 | MP0010678_abnormal_skin_adnexa | 0.64046857 |
| 76 | MP0009384_cardiac_valve_regurgitation | 0.64017714 |
| 77 | MP0000538_abnormal_urinary_bladder | 0.63990401 |
| 78 | MP0002272_abnormal_nervous_system | 0.63779403 |
| 79 | MP0003634_abnormal_glial_cell | 0.63715588 |
| 80 | MP0005334_abnormal_fat_pad | 0.63561035 |
| 81 | MP0000462_abnormal_digestive_system | 0.61994621 |
| 82 | MP0005623_abnormal_meninges_morphology | 0.61494075 |
| 83 | MP0002295_abnormal_pulmonary_circulatio | 0.61052092 |
| 84 | MP0001970_abnormal_pain_threshold | 0.60467431 |
| 85 | MP0000249_abnormal_blood_vessel | 0.60174591 |
| 86 | MP0001666_abnormal_nutrient_absorption | 0.59748881 |
| 87 | MP0002971_abnormal_brown_adipose | 0.59708632 |
| 88 | MP0004272_abnormal_basement_membrane | 0.57251656 |
| 89 | MP0000751_myopathy | 0.57185711 |
| 90 | MP0009053_abnormal_anal_canal | 0.56352921 |
| 91 | MP0002064_seizures | 0.55469725 |
| 92 | MP0005166_decreased_susceptibility_to | 0.54650712 |
| 93 | MP0002653_abnormal_ependyma_morphology | 0.53033620 |
| 94 | MP0000013_abnormal_adipose_tissue | 0.52761069 |
| 95 | MP0003959_abnormal_lean_body | 0.52286648 |
| 96 | MP0002138_abnormal_hepatobiliary_system | 0.51468059 |
| 97 | MP0004087_abnormal_muscle_fiber | 0.50474994 |
| 98 | MP0001177_atelectasis | 0.50286453 |
| 99 | MP0005164_abnormal_response_to | 0.48270717 |
| 100 | MP0006138_congestive_heart_failure | 0.47628528 |

| Rank | Gene Set | Z-score |
|---|---|---|
| 1 | Myocardial infarction (HP:0001658) | 5.39158966 |
| 2 | Hypophosphatemic rickets (HP:0004912) | 5.08112744 |
| 3 | Facial shape deformation (HP:0011334) | 4.76611636 |
| 4 | Potter facies (HP:0002009) | 4.76611636 |
| 5 | Vascular calcification (HP:0004934) | 4.72565970 |
| 6 | Complement deficiency (HP:0004431) | 4.61226437 |
| 7 | Cardiovascular calcification (HP:0011915) | 4.40667871 |
| 8 | Neurofibrillary tangles (HP:0002185) | 4.32804634 |
| 9 | Cerebral inclusion bodies (HP:0100314) | 4.20135081 |
| 10 | Malnutrition (HP:0004395) | 3.95569734 |
| 11 | Choroideremia (HP:0001139) | 3.73223884 |
| 12 | Neoplasm of the heart (HP:0100544) | 3.56326591 |
| 13 | Abnormality of complement system (HP:0005339) | 3.35848763 |
| 14 | Recurrent gram-negative bacterial infections (HP:0005420) | 3.22557570 |
| 15 | Infantile muscular hypotonia (HP:0008947) | 3.21094728 |
| 16 | Supranuclear gaze palsy (HP:0000605) | 3.19991933 |
| 17 | Widely patent fontanelles and sutures (HP:0004492) | 3.19299610 |
| 18 | Xanthomatosis (HP:0000991) | 3.17758511 |
| 19 | Intention tremor (HP:0002080) | 3.15441432 |
| 20 | Rickets (HP:0002748) | 3.13823690 |
| 21 | Deep venous thrombosis (HP:0002625) | 3.11832717 |
| 22 | Agitation (HP:0000713) | 3.04244352 |
| 23 | Choreoathetosis (HP:0001266) | 3.02939547 |
| 24 | Hemiplegia (HP:0002301) | 2.75597891 |
| 25 | Ketoacidosis (HP:0001993) | 2.70552708 |
| 26 | Ketosis (HP:0001946) | 2.50340063 |
| 27 | Abnormality of the fovea (HP:0000493) | 2.47559921 |
| 28 | Intrahepatic cholestasis (HP:0001406) | 2.44805197 |
| 29 | Difficulty running (HP:0009046) | 2.43301760 |
| 30 | Polar cataract (HP:0010696) | 2.43233862 |
| 31 | Hemorrhage of the eye (HP:0011885) | 2.37535206 |
| 32 | Gout (HP:0001997) | 2.36903251 |
| 33 | Vacuolated lymphocytes (HP:0001922) | 2.35784327 |
| 34 | Hypopigmentation of the fundus (HP:0007894) | 2.35781572 |
| 35 | Skin nodule (HP:0200036) | 2.30786027 |
| 36 | Abnormality of aromatic amino acid family metabolism (HP:0004338) | 2.29285105 |
| 37 | Hyporeflexia of lower limbs (HP:0002600) | 2.26325444 |
| 38 | Testicular atrophy (HP:0000029) | 2.26094208 |
| 39 | Acanthosis nigricans (HP:0000956) | 2.24915835 |
| 40 | Hyperglycinuria (HP:0003108) | 2.24837633 |
| 41 | Abnormality of purine metabolism (HP:0004352) | 2.19452472 |
| 42 | Peripheral hypomyelination (HP:0007182) | 2.19251497 |
| 43 | Abnormal hemoglobin (HP:0011902) | 2.17997667 |
| 44 | Epidermoid cyst (HP:0200040) | 2.14600553 |
| 45 | Gait ataxia (HP:0002066) | 2.10477046 |
| 46 | Osteomalacia (HP:0002749) | 2.10255439 |
| 47 | Hyperlipoproteinemia (HP:0010980) | 2.09542931 |
| 48 | Hepatoblastoma (HP:0002884) | 2.03384174 |
| 49 | Thin bony cortex (HP:0002753) | 2.02884570 |
| 50 | Focal segmental glomerulosclerosis (HP:0000097) | 2.02137759 |
| 51 | Abnormal rod and cone electroretinograms (HP:0008323) | 2.01623910 |
| 52 | Spastic diplegia (HP:0001264) | 1.99572755 |
| 53 | Abnormality of serine family amino acid metabolism (HP:0010894) | 1.99514603 |
| 54 | Abnormality of glycine metabolism (HP:0010895) | 1.99514603 |
| 55 | Myokymia (HP:0002411) | 1.98466664 |
| 56 | Ulnar claw (HP:0001178) | 1.96358873 |
| 57 | Right ventricular cardiomyopathy (HP:0011663) | 1.96285841 |
| 58 | Hyperparathyroidism (HP:0000843) | 1.96019084 |
| 59 | Segmental peripheral demyelination/remyelination (HP:0003481) | 1.91643741 |
| 60 | Muscle fiber splitting (HP:0003555) | 1.89214473 |
| 61 | Dysostosis multiplex (HP:0000943) | 1.88259394 |
| 62 | Increased connective tissue (HP:0009025) | 1.88013419 |
| 63 | Hypertriglyceridemia (HP:0002155) | 1.86738563 |
| 64 | Ectopia lentis (HP:0001083) | 1.86585318 |
| 65 | Systemic lupus erythematosus (HP:0002725) | 1.86342449 |
| 66 | Wide cranial sutures (HP:0010537) | 1.85878866 |
| 67 | Hyperammonemia (HP:0001987) | 1.85574156 |
| 68 | Hypoalphalipoproteinemia (HP:0003233) | 1.85084171 |
| 69 | Degeneration of the lateral corticospinal tracts (HP:0002314) | 1.81856159 |
| 70 | Atrophy/Degeneration involving the corticospinal tracts (HP:0007372) | 1.81856159 |
| 71 | Restlessness (HP:0000711) | 1.81599985 |
| 72 | Hyperphosphatemia (HP:0002905) | 1.81353424 |
| 73 | Prominent nose (HP:0000448) | 1.80959194 |
| 74 | Abnormality of monocarboxylic acid metabolism (HP:0010996) | 1.79754615 |
| 75 | Hypophosphatemia (HP:0002148) | 1.78613321 |
| 76 | Glomerulosclerosis (HP:0000096) | 1.76831936 |
| 77 | Gastrointestinal dysmotility (HP:0002579) | 1.76311634 |
| 78 | Psychosis (HP:0000709) | 1.74332545 |
| 79 | Increased CSF protein (HP:0002922) | 1.72234523 |
| 80 | Turricephaly (HP:0000262) | 1.71434879 |
| 81 | Bony spicule pigmentary retinopathy (HP:0007737) | 1.71229878 |
| 82 | Oligomenorrhea (HP:0000876) | 1.70450401 |
| 83 | Progressive neurologic deterioration (HP:0002344) | 1.69335610 |
| 84 | Amyloidosis (HP:0011034) | 1.67384078 |
| 85 | Pili torti (HP:0003777) | 1.66696809 |
| 86 | Tubulointerstitial fibrosis (HP:0005576) | 1.66577288 |
| 87 | Abnormality of the periventricular white matter (HP:0002518) | 1.65005901 |
| 88 | Abnormal cartilage morphology (HP:0002763) | 1.63336512 |
| 89 | Abnormality of the Achilles tendon (HP:0005109) | 1.62329039 |
| 90 | Calf muscle hypertrophy (HP:0008981) | 1.62107411 |
| 91 | Hyperglycinemia (HP:0002154) | 1.60832828 |
| 92 | Abnormality of sulfur amino acid metabolism (HP:0004339) | 1.60409186 |
| 93 | Back pain (HP:0003418) | 1.60073833 |
| 94 | Abnormality of transition element cation homeostasis (HP:0011030) | 1.58600131 |
| 95 | Abdominal situs inversus (HP:0003363) | 1.58203492 |
| 96 | Abnormality of abdominal situs (HP:0011620) | 1.58203492 |
| 97 | Subcapsular cataract (HP:0000523) | 1.57964115 |
| 98 | Prominent forehead (HP:0011220) | 1.57588112 |
| 99 | Abnormality of the corticospinal tract (HP:0002492) | 1.56452016 |
| 100 | Loss of speech (HP:0002371) | 1.56410244 |

| Rank | Gene Set | Z-score |
|---|---|---|
| 1 | MST4 | 3.67720564 |
| 2 | ERN1 | 3.28298596 |
| 3 | LMTK2 | 3.18224352 |
| 4 | EPHB1 | 2.83621463 |
| 5 | SIK1 | 2.66334261 |
| 6 | PKN2 | 2.54605839 |
| 7 | LRRK2 | 2.33129186 |
| 8 | PDGFRA | 2.18429370 |
| 9 | TRIB3 | 2.16490712 |
| 10 | FGFR2 | 2.15370108 |
| 11 | FER | 2.14070747 |
| 12 | FGFR4 | 1.93672206 |
| 13 | TAOK3 | 1.87328074 |
| 14 | STK39 | 1.84303841 |
| 15 | WNK4 | 1.82418201 |
| 16 | PRKD3 | 1.82091366 |
| 17 | MAP3K2 | 1.57041699 |
| 18 | PTK6 | 1.49587217 |
| 19 | EPHA2 | 1.44176449 |
| 20 | TNK2 | 1.42737003 |
| 21 | NTRK3 | 1.38558317 |
| 22 | TTN | 1.38332635 |
| 23 | RET | 1.36655387 |
| 24 | TYRO3 | 1.30816732 |
| 25 | PTK2B | 1.29246668 |
| 26 | NTRK1 | 1.27315040 |
| 27 | PAK3 | 1.25171188 |
| 28 | RIPK4 | 1.23451463 |
| 29 | PTK2 | 1.19008846 |
| 30 | MAP2K4 | 1.16705615 |
| 31 | MYLK | 1.14551326 |
| 32 | INSR | 1.12148717 |
| 33 | PRKCH | 1.10184761 |
| 34 | SCYL2 | 1.09479233 |
| 35 | PAK6 | 1.09024448 |
| 36 | KSR2 | 1.08998144 |
| 37 | CDK19 | 1.08441107 |
| 38 | STK10 | 1.07410307 |
| 39 | TESK1 | 1.07063380 |
| 40 | FRK | 1.01077502 |
| 41 | BCKDK | 1.00747459 |
| 42 | FGFR3 | 0.96915221 |
| 43 | DMPK | 0.90525031 |
| 44 | MAP3K7 | 0.90481845 |
| 45 | LATS2 | 0.89957718 |
| 46 | EPHB2 | 0.84308132 |
| 47 | PAK4 | 0.83127550 |
| 48 | CDK5 | 0.82634011 |
| 49 | ICK | 0.82621905 |
| 50 | ALK | 0.81328724 |
| 51 | PAK2 | 0.81040070 |
| 52 | SIK2 | 0.80688204 |
| 53 | EPHA4 | 0.80106368 |
| 54 | MAP3K6 | 0.77609351 |
| 55 | MAP3K12 | 0.77439718 |
| 56 | PDK4 | 0.73866810 |
| 57 | PDK3 | 0.73866810 |
| 58 | MAP2K1 | 0.72899001 |
| 59 | WNK1 | 0.72521670 |
| 60 | NTRK2 | 0.71748134 |
| 61 | PHKG2 | 0.70162691 |
| 62 | PHKG1 | 0.70162691 |
| 63 | MINK1 | 0.69969937 |
| 64 | CAMK1G | 0.69247484 |
| 65 | PRKCG | 0.69017763 |
| 66 | DDR2 | 0.67578697 |
| 67 | DAPK2 | 0.66258874 |
| 68 | GSK3A | 0.65932207 |
| 69 | JAK2 | 0.65222571 |
| 70 | FLT3 | 0.64039564 |
| 71 | STK38 | 0.63994514 |
| 72 | FGFR1 | 0.62744079 |
| 73 | ROCK2 | 0.62629293 |
| 74 | LATS1 | 0.61550417 |
| 75 | SRC | 0.60872319 |
| 76 | PDGFRB | 0.59582495 |
| 77 | UHMK1 | 0.59469832 |
| 78 | FYN | 0.58902884 |
| 79 | PRKD1 | 0.58682546 |
| 80 | EEF2K | 0.58349860 |
| 81 | PRKCZ | 0.55577896 |
| 82 | PRKACG | 0.54254480 |
| 83 | FES | 0.53215855 |
| 84 | AKT3 | 0.53120563 |
| 85 | MAP3K9 | 0.52941469 |
| 86 | CSNK1E | 0.51129303 |
| 87 | MET | 0.51021676 |
| 88 | CDK6 | 0.50629430 |
| 89 | MARK1 | 0.50579611 |
| 90 | ERBB2 | 0.49664712 |
| 91 | EGFR | 0.46350285 |
| 92 | CSK | 0.45841728 |
| 93 | PRKCQ | 0.45076197 |
| 94 | PDK1 | 0.43818871 |
| 95 | RIPK1 | 0.43716281 |
| 96 | MAP3K13 | 0.42160320 |
| 97 | JAK1 | 0.41332858 |
| 98 | PDPK1 | 0.40069004 |
| 99 | GRK5 | 0.39508067 |
| 100 | DAPK3 | 0.37877132 |

| Rank | Gene Set | Z-score |
|---|---|---|
| 1 | Nitrogen metabolism_Homo sapiens_hsa00910 | 5.69842540 |
| 2 | Tryptophan metabolism_Homo sapiens_hsa00380 | 3.79311962 |
| 3 | African trypanosomiasis_Homo sapiens_hsa05143 | 3.56685549 |
| 4 | Biosynthesis of unsaturated fatty acids_Homo sapiens_hsa01040 | 3.34601285 |
| 5 | Phenylalanine, tyrosine and tryptophan biosynthesis_Homo sapiens_hsa00400 | 3.02577289 |
| 6 | Sulfur metabolism_Homo sapiens_hsa00920 | 2.18890145 |
| 7 | Fatty acid degradation_Homo sapiens_hsa00071 | 2.18022065 |
| 8 | Fatty acid metabolism_Homo sapiens_hsa01212 | 2.14112761 |
| 9 | Arginine biosynthesis_Homo sapiens_hsa00220 | 2.08226710 |
| 10 | PPAR signaling pathway_Homo sapiens_hsa03320 | 1.80370092 |
| 11 | Glyoxylate and dicarboxylate metabolism_Homo sapiens_hsa00630 | 1.76488522 |
| 12 | Taurine and hypotaurine metabolism_Homo sapiens_hsa00430 | 1.69874701 |
| 13 | Alanine, aspartate and glutamate metabolism_Homo sapiens_hsa00250 | 1.66793922 |
| 14 | Valine, leucine and isoleucine degradation_Homo sapiens_hsa00280 | 1.54422149 |
| 15 | Salivary secretion_Homo sapiens_hsa04970 | 1.44693992 |
| 16 | Glycerolipid metabolism_Homo sapiens_hsa00561 | 1.43100762 |
| 17 | Mucin type O-Glycan biosynthesis_Homo sapiens_hsa00512 | 1.35900785 |
| 18 | Propanoate metabolism_Homo sapiens_hsa00640 | 1.28746032 |
| 19 | Primary bile acid biosynthesis_Homo sapiens_hsa00120 | 1.26331881 |
| 20 | 2-Oxocarboxylic acid metabolism_Homo sapiens_hsa01210 | 1.24998475 |
| 21 | Glycosaminoglycan biosynthesis - keratan sulfate_Homo sapiens_hsa00533 | 1.23814416 |
| 22 | Complement and coagulation cascades_Homo sapiens_hsa04610 | 1.23644796 |
| 23 | Gastric acid secretion_Homo sapiens_hsa04971 | 1.14072987 |
| 24 | Renin secretion_Homo sapiens_hsa04924 | 1.13283560 |
| 25 | Regulation of lipolysis in adipocytes_Homo sapiens_hsa04923 | 1.12248301 |
| 26 | Butanoate metabolism_Homo sapiens_hsa00650 | 1.10924961 |
| 27 | Bile secretion_Homo sapiens_hsa04976 | 1.10178920 |
| 28 | Lysosome_Homo sapiens_hsa04142 | 1.09815259 |
| 29 | Ascorbate and aldarate metabolism_Homo sapiens_hsa00053 | 1.09067346 |
| 30 | Proximal tubule bicarbonate reclamation_Homo sapiens_hsa04964 | 1.06924181 |
| 31 | Glycosphingolipid biosynthesis - ganglio series_Homo sapiens_hsa00604 | 1.05812957 |
| 32 | alpha-Linolenic acid metabolism_Homo sapiens_hsa00592 | 1.04992458 |
| 33 | Pantothenate and CoA biosynthesis_Homo sapiens_hsa00770 | 1.04701295 |
| 34 | Pyruvate metabolism_Homo sapiens_hsa00620 | 1.03806075 |
| 35 | Fat digestion and absorption_Homo sapiens_hsa04975 | 0.99574225 |
| 36 | beta-Alanine metabolism_Homo sapiens_hsa00410 | 0.99302122 |
| 37 | GABAergic synapse_Homo sapiens_hsa04727 | 0.98860566 |
| 38 | Long-term potentiation_Homo sapiens_hsa04720 | 0.95966881 |
| 39 | Other types of O-glycan biosynthesis_Homo sapiens_hsa00514 | 0.95365680 |
| 40 | Phenylalanine metabolism_Homo sapiens_hsa00360 | 0.94755415 |
| 41 | Starch and sucrose metabolism_Homo sapiens_hsa00500 | 0.89740682 |
| 42 | Vibrio cholerae infection_Homo sapiens_hsa05110 | 0.86235418 |
| 43 | Estrogen signaling pathway_Homo sapiens_hsa04915 | 0.85832021 |
| 44 | Collecting duct acid secretion_Homo sapiens_hsa04966 | 0.85187288 |
| 45 | Circadian entrainment_Homo sapiens_hsa04713 | 0.78500017 |
| 46 | Glycine, serine and threonine metabolism_Homo sapiens_hsa00260 | 0.77467930 |
| 47 | Synthesis and degradation of ketone bodies_Homo sapiens_hsa00072 | 0.76984255 |
| 48 | Prion diseases_Homo sapiens_hsa05020 | 0.76347181 |
| 49 | * Thyroid hormone synthesis_Homo sapiens_hsa04918 | 0.73572343 |
| 50 | Aldosterone synthesis and secretion_Homo sapiens_hsa04925 | 0.73463528 |
| 51 | Arginine and proline metabolism_Homo sapiens_hsa00330 | 0.72542148 |
| 52 | Fatty acid biosynthesis_Homo sapiens_hsa00061 | 0.71553800 |
| 53 | Histidine metabolism_Homo sapiens_hsa00340 | 0.71528930 |
| 54 | Fatty acid elongation_Homo sapiens_hsa00062 | 0.71255366 |
| 55 | Carbon metabolism_Homo sapiens_hsa01200 | 0.68997972 |
| 56 | Staphylococcus aureus infection_Homo sapiens_hsa05150 | 0.67806456 |
| 57 | Synaptic vesicle cycle_Homo sapiens_hsa04721 | 0.67587411 |
| 58 | Cyanoamino acid metabolism_Homo sapiens_hsa00460 | 0.66908631 |
| 59 | Citrate cycle (TCA cycle)_Homo sapiens_hsa00020 | 0.62206406 |
| 60 | Adrenergic signaling in cardiomyocytes_Homo sapiens_hsa04261 | 0.61515721 |
| 61 | Drug metabolism - cytochrome P450_Homo sapiens_hsa00982 | 0.61207570 |
| 62 | Protein processing in endoplasmic reticulum_Homo sapiens_hsa04141 | 0.61049795 |
| 63 | Biosynthesis of amino acids_Homo sapiens_hsa01230 | 0.60941552 |
| 64 | Amphetamine addiction_Homo sapiens_hsa05031 | 0.59014302 |
| 65 | Glutamatergic synapse_Homo sapiens_hsa04724 | 0.55566277 |
| 66 | Endocrine and other factor-regulated calcium reabsorption_Homo sapiens_hsa04961 | 0.52987600 |
| 67 | Vascular smooth muscle contraction_Homo sapiens_hsa04270 | 0.52931820 |
| 68 | Leukocyte transendothelial migration_Homo sapiens_hsa04670 | 0.52545801 |
| 69 | Peroxisome_Homo sapiens_hsa04146 | 0.51306604 |
| 70 | Folate biosynthesis_Homo sapiens_hsa00790 | 0.51182626 |
| 71 | Insulin secretion_Homo sapiens_hsa04911 | 0.49721420 |
| 72 | Glycosphingolipid biosynthesis - globo series_Homo sapiens_hsa00603 | 0.49492180 |
| 73 | * Glutathione metabolism_Homo sapiens_hsa00480 | 0.48635502 |
| 74 | Pentose and glucuronate interconversions_Homo sapiens_hsa00040 | 0.48279774 |
| 75 | Tyrosine metabolism_Homo sapiens_hsa00350 | 0.46749287 |
| 76 | Vitamin B6 metabolism_Homo sapiens_hsa00750 | 0.45990074 |
| 77 | Vasopressin-regulated water reabsorption_Homo sapiens_hsa04962 | 0.45703752 |
| 78 | Adipocytokine signaling pathway_Homo sapiens_hsa04920 | 0.44148468 |
| 79 | Metabolism of xenobiotics by cytochrome P450_Homo sapiens_hsa00980 | 0.43598677 |
| 80 | Chemical carcinogenesis_Homo sapiens_hsa05204 | 0.43469554 |
| 81 | GnRH signaling pathway_Homo sapiens_hsa04912 | 0.42502866 |
| 82 | Epithelial cell signaling in Helicobacter pylori infection_Homo sapiens_hsa05120 | 0.42180459 |
| 83 | Glucagon signaling pathway_Homo sapiens_hsa04922 | 0.42004909 |
| 84 | Glioma_Homo sapiens_hsa05214 | 0.41317111 |
| 85 | Glycolysis / Gluconeogenesis_Homo sapiens_hsa00010 | 0.40825401 |
| 86 | Nicotinate and nicotinamide metabolism_Homo sapiens_hsa00760 | 0.40805795 |
| 87 | Retrograde endocannabinoid signaling_Homo sapiens_hsa04723 | 0.39734267 |
| 88 | Cysteine and methionine metabolism_Homo sapiens_hsa00270 | 0.39525252 |
| 89 | N-Glycan biosynthesis_Homo sapiens_hsa00510 | 0.39409768 |
| 90 | Dopaminergic synapse_Homo sapiens_hsa04728 | 0.39246173 |
| 91 | ABC transporters_Homo sapiens_hsa02010 | 0.38808229 |
| 92 | Inflammatory mediator regulation of TRP channels_Homo sapiens_hsa04750 | 0.38180987 |
| 93 | Cholinergic synapse_Homo sapiens_hsa04725 | 0.36024491 |
| 94 | cAMP signaling pathway_Homo sapiens_hsa04024 | 0.33959516 |
| 95 | Melanogenesis_Homo sapiens_hsa04916 | 0.33563517 |
| 96 | cGMP-PKG signaling pathway_Homo sapiens_hsa04022 | 0.33359388 |
| 97 | Insulin resistance_Homo sapiens_hsa04931 | 0.32733996 |
| 98 | Olfactory transduction_Homo sapiens_hsa04740 | 0.32251886 |
| 99 | Oxytocin signaling pathway_Homo sapiens_hsa04921 | 0.30315140 |
| 100 | Cocaine addiction_Homo sapiens_hsa05030 | 0.29837200 |