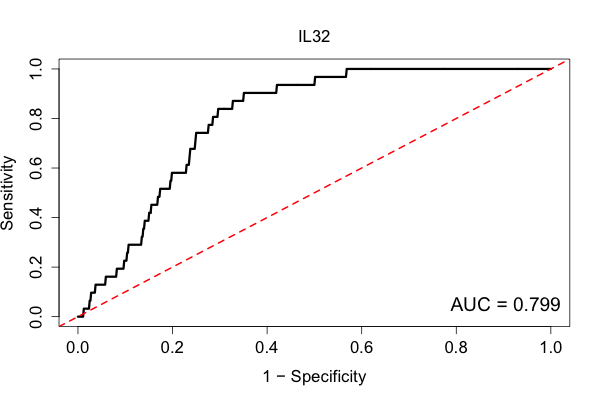
| Rank | Gene Set | Z-score |
|---|---|---|
| 1 | cytidine deamination (GO:0009972) | 8.12243092 |
| 2 | cytidine metabolic process (GO:0046087) | 8.12243092 |
| 3 | cytidine catabolic process (GO:0006216) | 8.12243092 |
| 4 | pyrimidine ribonucleoside catabolic process (GO:0046133) | 7.32973630 |
| 5 | regulation of single stranded viral RNA replication via double stranded DNA intermediate (GO:0045091 | 6.66349988 |
| 6 | DNA deamination (GO:0045006) | 5.91014669 |
| 7 | antigen processing and presentation of exogenous peptide antigen via MHC class I, TAP-independent (G | 5.88951294 |
| 8 | cellular response to interleukin-15 (GO:0071350) | 5.83901360 |
| 9 | negative T cell selection (GO:0043383) | 5.62462508 |
| 10 | positive regulation of gamma-delta T cell activation (GO:0046645) | 5.40752530 |
| 11 | response to interleukin-15 (GO:0070672) | 5.33597490 |
| 12 | antigen processing and presentation of endogenous peptide antigen (GO:0002483) | 5.18414381 |
| 13 | positive regulation of antigen receptor-mediated signaling pathway (GO:0050857) | 5.14398306 |
| 14 | regulation of regulatory T cell differentiation (GO:0045589) | 5.13147281 |
| 15 | T cell migration (GO:0072678) | 5.04906384 |
| 16 | negative thymic T cell selection (GO:0045060) | 4.97984909 |
| 17 | positive thymic T cell selection (GO:0045059) | 4.90586293 |
| 18 | positive T cell selection (GO:0043368) | 4.87224447 |
| 19 | negative regulation of cell killing (GO:0031342) | 4.87009055 |
| 20 | negative regulation of leukocyte mediated cytotoxicity (GO:0001911) | 4.87009055 |
| 21 | antigen processing and presentation of endogenous peptide antigen via MHC class I (GO:0019885) | 4.85875635 |
| 22 | regulation of B cell receptor signaling pathway (GO:0050855) | 4.83577472 |
| 23 | regulation of gamma-delta T cell differentiation (GO:0045586) | 4.81670582 |
| 24 | Arp2/3 complex-mediated actin nucleation (GO:0034314) | 4.81060989 |
| 25 | antigen processing and presentation of endogenous antigen (GO:0019883) | 4.74000913 |
| 26 | regulation of T cell tolerance induction (GO:0002664) | 4.73066965 |
| 27 | thymic T cell selection (GO:0045061) | 4.61278489 |
| 28 | regulation of natural killer cell mediated immunity (GO:0002715) | 4.51725837 |
| 29 | regulation of natural killer cell mediated cytotoxicity (GO:0042269) | 4.51725837 |
| 30 | positive regulation of natural killer cell mediated immunity (GO:0002717) | 4.49815693 |
| 31 | positive regulation of leukocyte mediated cytotoxicity (GO:0001912) | 4.42045063 |
| 32 | positive regulation of tolerance induction (GO:0002645) | 4.29299190 |
| 33 | positive regulation of natural killer cell mediated cytotoxicity (GO:0045954) | 4.28554081 |
| 34 | regulation of gamma-delta T cell activation (GO:0046643) | 4.26438784 |
| 35 | positive regulation of interleukin-2 biosynthetic process (GO:0045086) | 4.21800288 |
| 36 | regulation of leukocyte mediated cytotoxicity (GO:0001910) | 4.19462473 |
| 37 | actin nucleation (GO:0045010) | 4.15585719 |
| 38 | T cell selection (GO:0045058) | 4.14531914 |
| 39 | positive regulation of T cell mediated cytotoxicity (GO:0001916) | 4.12491281 |
| 40 | negative regulation of T cell apoptotic process (GO:0070233) | 4.05023397 |
| 41 | regulation of T cell mediated cytotoxicity (GO:0001914) | 4.02085821 |
| 42 | T cell costimulation (GO:0031295) | 4.00764099 |
| 43 | positive regulation of cell killing (GO:0031343) | 3.98604063 |
| 44 | lymphocyte costimulation (GO:0031294) | 3.95434005 |
| 45 | T cell receptor signaling pathway (GO:0050852) | 3.93244742 |
| 46 | positive regulation of calcium-mediated signaling (GO:0050850) | 3.92674031 |
| 47 | negative regulation of viral genome replication (GO:0045071) | 3.88809040 |
| 48 | regulation of activation of Janus kinase activity (GO:0010533) | 3.87016002 |
| 49 | regulation of alpha-beta T cell proliferation (GO:0046640) | 3.84372510 |
| 50 | regulation of cell killing (GO:0031341) | 3.84341852 |
| 51 | regulation of tolerance induction (GO:0002643) | 3.83409160 |
| 52 | pyrimidine nucleoside catabolic process (GO:0046135) | 3.73701378 |
| 53 | regulation of interleukin-2 biosynthetic process (GO:0045076) | 3.73289480 |
| 54 | positive regulation of interleukin-8 secretion (GO:2000484) | 3.69952462 |
| 55 | cytolysis (GO:0019835) | 3.64393949 |
| 56 | positive regulation of alpha-beta T cell proliferation (GO:0046641) | 3.64162901 |
| 57 | regulation of antigen receptor-mediated signaling pathway (GO:0050854) | 3.62716369 |
| 58 | dendritic cell chemotaxis (GO:0002407) | 3.59660024 |
| 59 | lymphocyte chemotaxis (GO:0048247) | 3.59044184 |
| 60 | eosinophil chemotaxis (GO:0048245) | 3.56577288 |
| 61 | regulation of T cell receptor signaling pathway (GO:0050856) | 3.54180506 |
| 62 | antigen receptor-mediated signaling pathway (GO:0050851) | 3.53088837 |
| 63 | regulation of lymphocyte chemotaxis (GO:1901623) | 3.52709857 |
| 64 | regulation of B cell differentiation (GO:0045577) | 3.51089222 |
| 65 | positive regulation of B cell differentiation (GO:0045579) | 3.50581208 |
| 66 | regulation of isotype switching to IgG isotypes (GO:0048302) | 3.50180857 |
| 67 | regulation of chronic inflammatory response (GO:0002676) | 3.44851481 |
| 68 | NIK/NF-kappaB signaling (GO:0038061) | 3.41094011 |
| 69 | tolerance induction (GO:0002507) | 3.40010645 |
| 70 | negative regulation by host of viral transcription (GO:0043922) | 3.37025295 |
| 71 | lymphocyte migration (GO:0072676) | 3.36642534 |
| 72 | antigen processing and presentation via MHC class Ib (GO:0002475) | 3.33424093 |
| 73 | positive regulation of lymphocyte migration (GO:2000403) | 3.32072362 |
| 74 | regulation of humoral immune response mediated by circulating immunoglobulin (GO:0002923) | 3.31230054 |
| 75 | positive regulation of T cell chemotaxis (GO:0010820) | 3.24699735 |
| 76 | regulation of T cell chemotaxis (GO:0010819) | 3.24699735 |
| 77 | type I interferon signaling pathway (GO:0060337) | 3.24235446 |
| 78 | cellular response to type I interferon (GO:0071357) | 3.24235446 |
| 79 | response to type I interferon (GO:0034340) | 3.20447887 |
| 80 | positive regulation of interleukin-4 production (GO:0032753) | 3.20447692 |
| 81 | leukocyte aggregation (GO:0070486) | 3.19809881 |
| 82 | eosinophil migration (GO:0072677) | 3.18806637 |
| 83 | macrophage chemotaxis (GO:0048246) | 3.17933028 |
| 84 | positive regulation of defense response to virus by host (GO:0002230) | 3.17800575 |
| 85 | cellular defense response (GO:0006968) | 3.13343544 |
| 86 | activated T cell proliferation (GO:0050798) | 3.13167724 |
| 87 | negative regulation of antigen receptor-mediated signaling pathway (GO:0050858) | 3.05951398 |
| 88 | dendritic cell migration (GO:0036336) | 3.05590473 |
| 89 | positive regulation of T cell mediated immunity (GO:0002711) | 3.04719085 |
| 90 | chemokine-mediated signaling pathway (GO:0070098) | 3.03995097 |
| 91 | regulation of antigen processing and presentation of peptide antigen (GO:0002583) | 3.01561477 |
| 92 | positive regulation of lymphocyte mediated immunity (GO:0002708) | 3.01238833 |
| 93 | immunoglobulin mediated immune response (GO:0016064) | 3.00840928 |
| 94 | regulation of T cell apoptotic process (GO:0070232) | 2.97787652 |
| 95 | regulation of lymphocyte migration (GO:2000401) | 2.96577417 |
| 96 | regulation of interleukin-8 secretion (GO:2000482) | 2.89593314 |
| 97 | response to interferon-beta (GO:0035456) | 2.88149817 |
| 98 | negative regulation of leukocyte mediated immunity (GO:0002704) | 2.84233537 |
| 99 | regulation of viral genome replication (GO:0045069) | 2.83392827 |
| 100 | positive regulation of T cell migration (GO:2000406) | 2.81620910 |

| Rank | Gene Set | Z-score |
|---|---|---|
| 1 | BP1_19119308_ChIP-ChIP_Hs578T_Human | 7.49391270 |
| 2 | IRF8_22096565_ChIP-ChIP_GC-B_Human | 5.72873375 |
| 3 | STAT6_20620947_ChIP-Seq_CD4_POS_T_Human | 5.63839946 |
| 4 | IRF1_21803131_ChIP-Seq_MONOCYTES_Human | 5.35238084 |
| 5 | FOXP3_17237761_ChIP-ChIP_TREG_Mouse | 4.95340290 |
| 6 | IRF8_22096565_ChIP-ChIP_GC-B_Mouse | 3.45047402 |
| 7 | IRF8_21731497_ChIP-ChIP_J774_Mouse | 3.41110077 |
| 8 | RUNX_20019798_ChIP-Seq_JUKART_Human | 3.34881068 |
| 9 | * MYB_26560356_Chip-Seq_TH2_Human | 3.23591953 |
| 10 | STAT4_19710469_ChIP-ChIP_TH1__Mouse | 3.17934101 |
| 11 | STAT3_20064451_ChIP-Seq_CD4+T_Mouse | 2.82484909 |
| 12 | RUNX1_20887958_ChIP-Seq_HPC-7_Mouse | 2.68604576 |
| 13 | ELF1_17652178_ChIP-ChIP_JURKAT_Human | 2.65216935 |
| 14 | MYB_26560356_Chip-Seq_TH1_Human | 2.49838934 |
| 15 | SPI1_22096565_ChIP-ChIP_GC-B_Mouse | 2.41967129 |
| 16 | MAF_26560356_Chip-Seq_TH1_Human | 2.40747434 |
| 17 | * UTX_26944678_Chip-Seq_JUKART_Human | 2.35614425 |
| 18 | MECOM_23826213_ChIP-Seq_KASUMI_Mouse | 2.30698710 |
| 19 | * GATA3_27048872_Chip-Seq_THYMUS_Human | 2.24568181 |
| 20 | FOXO1_25302145_ChIP-Seq_T-LYMPHOCYTE_Mouse | 2.22762982 |
| 21 | SOX9_22984422_ChIP-ChIP_TESTIS_Rat | 2.18868645 |
| 22 | MAF_26560356_Chip-Seq_TH2_Human | 2.08524484 |
| 23 | GATA3_26560356_Chip-Seq_TH2_Human | 1.84874311 |
| 24 | LYL1_20887958_ChIP-Seq_HPC-7_Mouse | 1.83100893 |
| 25 | * RELA_24523406_ChIP-Seq_FIBROSARCOMA_Human | 1.82609380 |
| 26 | IRF8_27001747_Chip-Seq_BMDM_Mouse | 1.78703022 |
| 27 | E2A_27217539_Chip-Seq_RAMOS-Cell_line_Human | 1.72531537 |
| 28 | SMRT_22465074_ChIP-Seq_MACROPHAGES_Mouse | 1.69762038 |
| 29 | NOTCH1_17114293_ChIP-ChIP_T-ALL_Human | 1.67607567 |
| 30 | SPI1_23547873_ChIP-Seq_NB4_Human | 1.64733833 |
| 31 | FLI1_20887958_ChIP-Seq_HPC-7_Mouse | 1.64600707 |
| 32 | MEIS1_20887958_ChIP-Seq_HPC-7_Mouse | 1.56153865 |
| 33 | SMAD_19615063_ChIP-ChIP_OVARY_Human | 1.55348162 |
| 34 | CTNNB1_24651522_ChIP-Seq_LGR5+_INTESTINAL_STEM_Human | 1.52799745 |
| 35 | GATA2_20887958_ChIP-Seq_HPC-7_Mouse | 1.51845154 |
| 36 | LMO2_20887958_ChIP-Seq_HPC-7_Mouse | 1.46464449 |
| 37 | NR1H3_23393188_ChIP-Seq_ATHEROSCLEROTIC-FOAM_Human | 1.41204258 |
| 38 | RUNX1_22412390_ChIP-Seq_EML_Mouse | 1.38400694 |
| 39 | * BCL6_27268052_Chip-Seq_Bcells_Human | 1.36513500 |
| 40 | SPI1_22790984_ChIP-Seq_ERYTHROLEUKEMIA_Mouse | 1.35280387 |
| 41 | NCOR_22465074_ChIP-Seq_MACROPHAGES_Mouse | 1.33505040 |
| 42 | EGR1_23403033_ChIP-Seq_LIVER_Mouse | 1.32430217 |
| 43 | PPARA_22158963_ChIP-Seq_LIVER_Mouse | 1.27075103 |
| 44 | STAT6_21828071_ChIP-Seq_BEAS2B_Human | 1.26569768 |
| 45 | FOXP1_22492998_ChIP-Seq_STRATIUM_Mouse | 1.21657146 |
| 46 | BRD4_27068464_Chip-Seq_AML-cells_Mouse | 1.19813223 |
| 47 | E4F1_26484288_ChIP-Seq_MOUSE_EMBRYONIC_FIBROBLAST_Mouse | 1.19714086 |
| 48 | VDR_24763502_ChIP-Seq_THP-1_Human | 1.17456162 |
| 49 | CEBPA_23403033_ChIP-Seq_LIVER_Mouse | 1.15413977 |
| 50 | ESR1_17901129_ChIP-ChIP_LIVER_Mouse | 1.14198028 |
| 51 | NOTCH1_21737748_ChIP-Seq_TLL_Human | 1.13041987 |
| 52 | SPI1_23127762_ChIP-Seq_K562_Human | 1.10219299 |
| 53 | RUNX1_17652178_ChIP-ChIP_JURKAT_Human | 1.10107098 |
| 54 | * BCOR_27268052_Chip-Seq_Bcells_Human | 1.08322207 |
| 55 | MYC_22102868_ChIP-Seq_BL_Human | 1.06712509 |
| 56 | CEBPB_20176806_ChIP-Seq_MACROPHAGES_Mouse | 1.05187376 |
| 57 | CEBPB_20176806_ChIP-Seq_THIOMACROPHAGE_Mouse | 1.05044886 |
| 58 | GATA2_22383799_ChIP-Seq_G1ME_Mouse | 1.04865898 |
| 59 | SA1_27219007_Chip-Seq_Bcells_Human | 1.01059120 |
| 60 | TAL1_22897851_ChIP-Seq_JUKARTE6-1_Human | 0.99764712 |
| 61 | P300_27268052_Chip-Seq_Bcells_Human | 0.99290446 |
| 62 | RXR_22158963_ChIP-Seq_LIVER_Mouse | 0.96700886 |
| 63 | PBX1_22567123_ChIP-ChIP_OVCAR3_Human | 0.96652767 |
| 64 | * ELF1_20517297_ChIP-Seq_JURKAT_Human | 0.96510827 |
| 65 | CIITA_25753668_ChIP-Seq_RAJI_Human | 0.94612824 |
| 66 | CEBPB_20513432_ChIP-Seq_MACROPHAGES_Mouse | 0.94265355 |
| 67 | MYB_21317192_ChIP-Seq_ERMYB_Mouse | 0.93321595 |
| 68 | * RBPJ_21746931_ChIP-Seq_IB4-LCL_Human | 0.92775151 |
| 69 | TAL1_20887958_ChIP-Seq_HPC-7_Mouse | 0.92577267 |
| 70 | * EBNA2_21746931_ChIP-Seq_IB4-LCL_Human | 0.91554667 |
| 71 | CEBPA_20513432_ChIP-Seq_MACROPHAGES_Mouse | 0.91221965 |
| 72 | STAT5_23275557_ChIP-Seq_MAMMARY-EPITHELIUM_Mouse | 0.88663024 |
| 73 | LXR_22292898_ChIP-Seq_THP-1_Human | 0.87636652 |
| 74 | BMI1_19503595_ChIP-Seq_MEFsC_Mouse | 0.87487021 |
| 75 | VDR_21846776_ChIP-Seq_THP-1_Human | 0.87001150 |
| 76 | SCL_19346495_ChIP-Seq_HPC-7_Human | 0.86176474 |
| 77 | PBX_27287812_Chip-Seq_EMBYONIC-LIMB_Mouse | 0.86008288 |
| 78 | SPI1_20176806_ChIP-Seq_THIOMACROPHAGE_Mouse | 0.84651771 |
| 79 | RUNX1_22897851_ChIP-Seq_JUKARTE6-1_Human | 0.84005828 |
| 80 | NANOG_20526341_ChIP-Seq_ESCs_Human | 0.83366758 |
| 81 | GATA1_22025678_ChIP-Seq_K562_Human | 0.81336228 |
| 82 | THRA_23701648_ChIP-Seq_CEREBELLUM_Mouse | 0.81246407 |
| 83 | CTCF_20526341_ChIP-Seq_ESCs_Human | 0.80902545 |
| 84 | SPI1_20517297_ChIP-Seq_HL60_Human | 0.80587559 |
| 85 | PU.1_20513432_ChIP-Seq_MACROPHAGES_Mouse | 0.79216979 |
| 86 | PU.1_20513432_ChIP-Seq_Bcells_Mouse | 0.77862823 |
| 87 | VDR_20736230_ChIP-Seq_LYMPHOBLASTOID_Human | 0.77435507 |
| 88 | * YY1_22570637_ChIP-Seq_MALME-3M_Human | 0.76596795 |
| 89 | PU.1_20176806_ChIP-Seq_MACROPHAGES_Mouse | 0.76542819 |
| 90 | * TAF2_19829295_ChIP-Seq_ESCs_Human | 0.74133596 |
| 91 | VDR_23849224_ChIP-Seq_CD4+_Human | 0.73354410 |
| 92 | * GATA3_26560356_Chip-Seq_TH1_Human | 0.73006557 |
| 93 | PAX6_23342162_ChIP-ChIP_BETA-FORBRAIN-LENS_Mouse | 0.72741470 |
| 94 | TBP_23326641_ChIP-Seq_C3H10T1-2_Mouse | 0.72356980 |
| 95 | FLI1_21571218_ChIP-Seq_MEGAKARYOCYTES_Human | 0.71250651 |
| 96 | CTCF_26484167_Chip-Seq_Bcells_Mouse | 0.70072296 |
| 97 | SRY_22984422_ChIP-ChIP_TESTIS_Rat | 0.69568557 |
| 98 | * ELK3_25401928_ChIP-Seq_HUVEC_Human | 0.69359005 |
| 99 | ETS1_21867929_ChIP-Seq_TH2_Mouse | 0.69192833 |
| 100 | PPARG_20176806_ChIP-Seq_THIOMACROPHAGE_Mouse | 0.68842225 |

| Rank | Gene Set | Z-score |
|---|---|---|
| 1 | MP0005671_abnormal_response_to | 5.92171816 |
| 2 | MP0003763_abnormal_thymus_physiology | 4.12115210 |
| 3 | MP0009785_altered_susceptibility_to | 3.65340610 |
| 4 | MP0001835_abnormal_antigen_presentation | 3.56271170 |
| 5 | MP0009333_abnormal_splenocyte_physiolog | 3.36944676 |
| 6 | MP0005000_abnormal_immune_tolerance | 3.17450037 |
| 7 | MP0001800_abnormal_humoral_immune | 3.09179970 |
| 8 | MP0003436_decreased_susceptibility_to | 2.94475153 |
| 9 | MP0005025_abnormal_response_to | 2.88648209 |
| 10 | MP0001790_abnormal_immune_system | 2.85161516 |
| 11 | MP0005387_immune_system_phenotype | 2.85161516 |
| 12 | MP0000685_abnormal_immune_system | 2.78307592 |
| 13 | MP0003866_abnormal_defecation | 2.75850865 |
| 14 | MP0002723_abnormal_immune_serum | 2.72309186 |
| 15 | MP0006082_CNS_inflammation | 2.71987617 |
| 16 | MP0002420_abnormal_adaptive_immunity | 2.64467422 |
| 17 | MP0010155_abnormal_intestine_physiology | 2.60303603 |
| 18 | MP0001819_abnormal_immune_cell | 2.59685723 |
| 19 | MP0002148_abnormal_hypersensitivity_rea | 2.54980575 |
| 20 | MP0001873_stomach_inflammation | 2.51284994 |
| 21 | MP0002166_altered_tumor_susceptibility | 2.49739184 |
| 22 | MP0002452_abnormal_antigen_presenting | 2.33800272 |
| 23 | MP0003724_increased_susceptibility_to | 2.32132155 |
| 24 | MP0005360_urolithiasis | 2.22463379 |
| 25 | MP0002398_abnormal_bone_marrow | 2.08662962 |
| 26 | MP0000716_abnormal_immune_system | 2.06840313 |
| 27 | MP0002419_abnormal_innate_immunity | 2.03931407 |
| 28 | MP0002405_respiratory_system_inflammati | 2.01512079 |
| 29 | MP0001845_abnormal_inflammatory_respons | 1.93733597 |
| 30 | MP0002933_joint_inflammation | 1.88880086 |
| 31 | MP0002138_abnormal_hepatobiliary_system | 1.87224161 |
| 32 | MP0000703_abnormal_thymus_morphology | 1.84555800 |
| 33 | MP0002006_tumorigenesis | 1.81049067 |
| 34 | MP0002139_abnormal_hepatobiliary_system | 1.75839598 |
| 35 | MP0004947_skin_inflammation | 1.74281363 |
| 36 | MP0002722_abnormal_immune_system | 1.73517410 |
| 37 | MP0000689_abnormal_spleen_morphology | 1.70003134 |
| 38 | MP0002429_abnormal_blood_cell | 1.60071946 |
| 39 | MP0008469_abnormal_protein_level | 1.50080045 |
| 40 | MP0003045_fibrosis | 1.48227826 |
| 41 | MP0005464_abnormal_platelet_physiology | 1.46638251 |
| 42 | MP0001533_abnormal_skeleton_physiology | 1.41696040 |
| 43 | MP0003448_altered_tumor_morphology | 1.38839614 |
| 44 | MP0005085_abnormal_gallbladder_physiolo | 1.35765786 |
| 45 | MP0001853_heart_inflammation | 1.32504274 |
| 46 | MP0001666_abnormal_nutrient_absorption | 1.31875591 |
| 47 | MP0003300_gastrointestinal_ulcer | 1.30279708 |
| 48 | MP0005365_abnormal_bile_salt | 1.25237177 |
| 49 | MP0005310_abnormal_salivary_gland | 1.24815659 |
| 50 | MP0003252_abnormal_bile_duct | 1.20681219 |
| 51 | MP0002277_abnormal_respiratory_mucosa | 1.18379412 |
| 52 | MP0005166_decreased_susceptibility_to | 1.16480327 |
| 53 | MP0009763_increased_sensitivity_to | 1.13797340 |
| 54 | MP0000858_altered_metastatic_potential | 1.09857802 |
| 55 | MP0009840_abnormal_foam_cell | 1.06354980 |
| 56 | MP0003183_abnormal_peptide_metabolism | 1.04999679 |
| 57 | MP0009764_decreased_sensitivity_to | 1.04501637 |
| 58 | MP0002876_abnormal_thyroid_physiology | 1.04195289 |
| 59 | MP0003806_abnormal_nucleotide_metabolis | 1.01679421 |
| 60 | MP0009643_abnormal_urine_homeostasis | 0.95473687 |
| 61 | MP0000465_gastrointestinal_hemorrhage | 0.91819406 |
| 62 | MP0004381_abnormal_hair_follicle | 0.88480562 |
| 63 | MP0002132_abnormal_respiratory_system | 0.85434985 |
| 64 | MP0000604_amyloidosis | 0.84771883 |
| 65 | MP0000490_abnormal_crypts_of | 0.81638199 |
| 66 | MP0002136_abnormal_kidney_physiology | 0.81145544 |
| 67 | MP0005075_abnormal_melanosome_morpholog | 0.81087375 |
| 68 | MP0002998_abnormal_bone_remodeling | 0.79846177 |
| 69 | MP0002693_abnormal_pancreas_physiology | 0.74239815 |
| 70 | MP0010329_abnormal_lipoprotein_level | 0.74227813 |
| 71 | MP0001765_abnormal_ion_homeostasis | 0.73332872 |
| 72 | MP0008875_abnormal_xenobiotic_pharmacok | 0.69304048 |
| 73 | MP0000609_abnormal_liver_physiology | 0.68569574 |
| 74 | MP0003075_altered_response_to | 0.68097669 |
| 75 | MP0001663_abnormal_digestive_system | 0.66693059 |
| 76 | MP0002019_abnormal_tumor_incidence | 0.65794201 |
| 77 | MP0009765_abnormal_xenobiotic_induced | 0.64501739 |
| 78 | MP0001919_abnormal_reproductive_system | 0.64347680 |
| 79 | MP0002163_abnormal_gland_morphology | 0.64096346 |
| 80 | MP0000249_abnormal_blood_vessel | 0.62450752 |
| 81 | MP0005584_abnormal_enzyme/coenzyme_acti | 0.61786505 |
| 82 | MP0003195_calcinosis | 0.59484137 |
| 83 | MP0001764_abnormal_homeostasis | 0.58203559 |
| 84 | MP0005377_hearing/vestibular/ear_phenot | 0.57714707 |
| 85 | MP0003878_abnormal_ear_physiology | 0.57714707 |
| 86 | MP0005332_abnormal_amino_acid | 0.56833071 |
| 87 | MP0005319_abnormal_enzyme/_coenzyme | 0.55556406 |
| 88 | MP0001851_eye_inflammation | 0.55053483 |
| 89 | MP0005636_abnormal_mineral_homeostasis | 0.55045222 |
| 90 | MP0000477_abnormal_intestine_morphology | 0.55023289 |
| 91 | MP0009642_abnormal_blood_homeostasis | 0.55019226 |
| 92 | MP0008872_abnormal_physiological_respon | 0.52152782 |
| 93 | MP0001661_extended_life_span | 0.51549213 |
| 94 | MP0005390_skeleton_phenotype | 0.50751908 |
| 95 | MP0002009_preneoplasia | 0.50705001 |
| 96 | MP0008873_increased_physiological_sensi | 0.49866298 |
| 97 | MP0003868_abnormal_feces_composition | 0.49031701 |
| 98 | MP0003303_peritoneal_inflammation | 0.48090303 |
| 99 | MP0004147_increased_porphyrin_level | 0.47847826 |
| 100 | MP0003795_abnormal_bone_structure | 0.47403724 |

| Rank | Gene Set | Z-score |
|---|---|---|
| 1 | T lymphocytopenia (HP:0005403) | 6.97191869 |
| 2 | Abnormality of T cell number (HP:0011839) | 6.63168821 |
| 3 | Autoimmune hemolytic anemia (HP:0001890) | 5.12079035 |
| 4 | Abnormality of T cells (HP:0002843) | 5.05567902 |
| 5 | Elevated erythrocyte sedimentation rate (HP:0003565) | 4.93154589 |
| 6 | IgG deficiency (HP:0004315) | 4.84326293 |
| 7 | Chronic diarrhea (HP:0002028) | 4.58611842 |
| 8 | Severe combined immunodeficiency (HP:0004430) | 4.50194679 |
| 9 | Increased IgM level (HP:0003496) | 4.40399544 |
| 10 | Aplastic anemia (HP:0001915) | 4.13850546 |
| 11 | Abnormal delayed hypersensitivity skin test (HP:0002963) | 4.13468186 |
| 12 | Stomatitis (HP:0010280) | 4.07007239 |
| 13 | Myositis (HP:0100614) | 3.81620188 |
| 14 | Abnormality of macrophages (HP:0004311) | 3.80811357 |
| 15 | Recurrent bronchitis (HP:0002837) | 3.73840448 |
| 16 | Abnormality of eosinophils (HP:0001879) | 3.68563257 |
| 17 | Encephalitis (HP:0002383) | 3.62280142 |
| 18 | Hypoproteinemia (HP:0003075) | 3.60514372 |
| 19 | Meningitis (HP:0001287) | 3.60486003 |
| 20 | Eczematoid dermatitis (HP:0000976) | 3.57413971 |
| 21 | Combined immunodeficiency (HP:0005387) | 3.56536753 |
| 22 | Joint swelling (HP:0001386) | 3.51923638 |
| 23 | Abnormality of T cell physiology (HP:0011840) | 3.45337866 |
| 24 | Pustule (HP:0200039) | 3.43125417 |
| 25 | Vasculitis (HP:0002633) | 3.42537068 |
| 26 | Recurrent fungal infections (HP:0002841) | 3.39427881 |
| 27 | Gastrointestinal infarctions (HP:0005244) | 3.39385980 |
| 28 | Lymphopenia (HP:0001888) | 3.37202330 |
| 29 | Pulmonary infiltrates (HP:0002113) | 3.37131137 |
| 30 | Recurrent viral infections (HP:0004429) | 3.28975101 |
| 31 | Abnormality of cells of the lymphoid lineage (HP:0012140) | 3.28484285 |
| 32 | Retrobulbar optic neuritis (HP:0100654) | 3.27093553 |
| 33 | Optic neuritis (HP:0100653) | 3.27093553 |
| 34 | IgM deficiency (HP:0002850) | 3.24487834 |
| 35 | Eosinophilia (HP:0001880) | 3.24418863 |
| 36 | Obstructive lung disease (HP:0006536) | 3.22428508 |
| 37 | Chronic obstructive pulmonary disease (HP:0006510) | 3.22428508 |
| 38 | Chronic mucocutaneous candidiasis (HP:0002728) | 3.20938567 |
| 39 | Recurrent cutaneous fungal infections (HP:0011370) | 3.20938567 |
| 40 | Orchitis (HP:0100796) | 3.20859076 |
| 41 | Thyroiditis (HP:0100646) | 3.15153140 |
| 42 | Abnormality of the prostate (HP:0008775) | 3.13203481 |
| 43 | Leukocytosis (HP:0001974) | 3.04181988 |
| 44 | Granulocytopenia (HP:0001913) | 3.04118808 |
| 45 | Recurrent abscess formation (HP:0002722) | 2.91912756 |
| 46 | Autoimmune thrombocytopenia (HP:0001973) | 2.82061395 |
| 47 | Recurrent bacterial skin infections (HP:0005406) | 2.77440670 |
| 48 | Gangrene (HP:0100758) | 2.76421400 |
| 49 | Hemoptysis (HP:0002105) | 2.73699356 |
| 50 | Mediastinal lymphadenopathy (HP:0100721) | 2.73624723 |
| 51 | Chest pain (HP:0100749) | 2.73015023 |
| 52 | Abnormality of B cell number (HP:0010975) | 2.69802190 |
| 53 | Recurrent skin infections (HP:0001581) | 2.69525905 |
| 54 | Agammaglobulinemia (HP:0004432) | 2.68926964 |
| 55 | Hypergammaglobulinemia (HP:0010702) | 2.68661523 |
| 56 | Panhypogammaglobulinemia (HP:0003139) | 2.67002455 |
| 57 | Pulmonary embolism (HP:0002204) | 2.65941426 |
| 58 | Abnormality of the pleura (HP:0002103) | 2.46942677 |
| 59 | Keratoconjunctivitis sicca (HP:0001097) | 2.46019118 |
| 60 | Lymphoma (HP:0002665) | 2.40441071 |
| 61 | Hypoplasia of the thymus (HP:0000778) | 2.37631564 |
| 62 | B lymphocytopenia (HP:0010976) | 2.36551892 |
| 63 | IgA deficiency (HP:0002720) | 2.33045899 |
| 64 | Keratoconjunctivitis (HP:0001096) | 2.29987430 |
| 65 | Abnormality of glutamine family amino acid metabolism (HP:0010902) | 2.26772472 |
| 66 | Bronchitis (HP:0012387) | 2.24415036 |
| 67 | Skin rash (HP:0000988) | 2.23319044 |
| 68 | Recurrent gram-negative bacterial infections (HP:0005420) | 2.22798526 |
| 69 | Acute hepatic failure (HP:0006554) | 2.22209765 |
| 70 | Increased IgE level (HP:0003212) | 2.18750092 |
| 71 | Inflammation of the large intestine (HP:0002037) | 2.14212174 |
| 72 | Systemic lupus erythematosus (HP:0002725) | 2.08158166 |
| 73 | Spontaneous hematomas (HP:0007420) | 2.05450076 |
| 74 | Ureteral stenosis (HP:0000071) | 2.05192368 |
| 75 | Pancreatitis (HP:0001733) | 2.04359466 |
| 76 | Abnormal albumin level (HP:0012116) | 2.04139791 |
| 77 | Hypoalbuminemia (HP:0003073) | 2.04139791 |
| 78 | Anorexia (HP:0002039) | 2.04139351 |
| 79 | Glomerulopathy (HP:0100820) | 1.99682297 |
| 80 | Pulmonary fibrosis (HP:0002206) | 1.99247593 |
| 81 | Gastrointestinal inflammation (HP:0004386) | 1.99146045 |
| 82 | Arterial thrombosis (HP:0004420) | 1.98000187 |
| 83 | Hemiplegia (HP:0002301) | 1.97281527 |
| 84 | Recurrent otitis media (HP:0000403) | 1.96519196 |
| 85 | Epistaxis (HP:0000421) | 1.96346946 |
| 86 | Hypochromic anemia (HP:0001931) | 1.96135410 |
| 87 | Gastrointestinal stroma tumor (HP:0100723) | 1.95702906 |
| 88 | Purpura (HP:0000979) | 1.92724208 |
| 89 | Urticaria (HP:0001025) | 1.92083991 |
| 90 | Cerebral palsy (HP:0100021) | 1.89922820 |
| 91 | Ureteral obstruction (HP:0006000) | 1.89871162 |
| 92 | Increased serum ferritin (HP:0003281) | 1.86818570 |
| 93 | Thrombophlebitis (HP:0004418) | 1.85265563 |
| 94 | Polyneuropathy (HP:0001271) | 1.84505290 |
| 95 | Gingival bleeding (HP:0000225) | 1.83186340 |
| 96 | Arthralgia (HP:0002829) | 1.82799653 |
| 97 | Abnormality of the pericardium (HP:0001697) | 1.80806001 |
| 98 | Malnutrition (HP:0004395) | 1.79763972 |
| 99 | Abnormality of male internal genitalia (HP:0000022) | 1.77156910 |
| 100 | Gingivitis (HP:0000230) | 1.77091298 |

| Rank | Gene Set | Z-score |
|---|---|---|
| 1 | TXK | 6.96883326 |
| 2 | KDR | 4.87377075 |
| 3 | MAP4K1 | 4.74135325 |
| 4 | TESK2 | 4.47232233 |
| 5 | ITK | 2.81741446 |
| 6 | TAOK3 | 2.56740488 |
| 7 | FES | 2.33056270 |
| 8 | ZAP70 | 2.18254920 |
| 9 | CSK | 2.09716970 |
| 10 | RIPK4 | 1.97039409 |
| 11 | IKBKE | 1.94929535 |
| 12 | GRK6 | 1.93736577 |
| 13 | TESK1 | 1.88389134 |
| 14 | SYK | 1.83826007 |
| 15 | LCK | 1.80740040 |
| 16 | TBK1 | 1.70425467 |
| 17 | TYK2 | 1.64487874 |
| 18 | JAK3 | 1.63296249 |
| 19 | BTK | 1.60875451 |
| 20 | MAP3K12 | 1.60790281 |
| 21 | MAP3K11 | 1.53007977 |
| 22 | PRKCQ | 1.52670401 |
| 23 | JAK1 | 1.44732403 |
| 24 | BCKDK | 1.43159615 |
| 25 | MAPKAPK3 | 1.38577522 |
| 26 | TLK1 | 1.37205023 |
| 27 | MAP3K14 | 1.31322342 |
| 28 | ERN1 | 1.22566464 |
| 29 | IKBKB | 1.22290321 |
| 30 | LYN | 1.19406977 |
| 31 | TEC | 1.15975082 |
| 32 | TNK2 | 1.14076695 |
| 33 | BLK | 1.13214603 |
| 34 | LIMK1 | 1.11697068 |
| 35 | GRK7 | 1.09792719 |
| 36 | FGFR4 | 1.08954328 |
| 37 | CSF1R | 1.05238102 |
| 38 | ADRBK2 | 1.02204209 |
| 39 | IRAK4 | 0.95853366 |
| 40 | HCK | 0.90532071 |
| 41 | MST4 | 0.89624766 |
| 42 | PIK3CA | 0.88027060 |
| 43 | JAK2 | 0.83370473 |
| 44 | MAPK11 | 0.81273363 |
| 45 | FYN | 0.79392759 |
| 46 | MAP2K6 | 0.76310325 |
| 47 | SCYL2 | 0.71531990 |
| 48 | CAMKK2 | 0.70825758 |
| 49 | KIT | 0.70196478 |
| 50 | PIM1 | 0.67805486 |
| 51 | DAPK1 | 0.66508739 |
| 52 | MUSK | 0.65382615 |
| 53 | PIK3CG | 0.64657833 |
| 54 | VRK2 | 0.63908489 |
| 55 | PDK1 | 0.63600776 |
| 56 | MYLK | 0.62291283 |
| 57 | STK10 | 0.60288094 |
| 58 | MAP2K2 | 0.57477847 |
| 59 | TYRO3 | 0.56873760 |
| 60 | EPHB1 | 0.53629586 |
| 61 | PRPF4B | 0.52607253 |
| 62 | IGF1R | 0.52409678 |
| 63 | ZAK | 0.51655741 |
| 64 | MAP3K13 | 0.49814405 |
| 65 | MAPKAPK2 | 0.48036853 |
| 66 | MARK3 | 0.47869541 |
| 67 | SIK3 | 0.47597336 |
| 68 | BMPR2 | 0.43555261 |
| 69 | INSR | 0.43281709 |
| 70 | ACVR1B | 0.41300559 |
| 71 | NLK | 0.40922294 |
| 72 | FGFR3 | 0.39959135 |
| 73 | MATK | 0.39393894 |
| 74 | CLK1 | 0.38650653 |
| 75 | GRK1 | 0.37859947 |
| 76 | MAP4K2 | 0.37485224 |
| 77 | CAMKK1 | 0.36802129 |
| 78 | PRKCH | 0.35836797 |
| 79 | MAP3K3 | 0.35347050 |
| 80 | VRK1 | 0.34711488 |
| 81 | WNK4 | 0.33922078 |
| 82 | EPHA3 | 0.33850265 |
| 83 | TGFBR2 | 0.32639084 |
| 84 | TAOK2 | 0.32074071 |
| 85 | MAP3K5 | 0.30784406 |
| 86 | CDK4 | 0.28624922 |
| 87 | PASK | 0.28074172 |
| 88 | FGR | 0.27575659 |
| 89 | OBSCN | 0.27040620 |
| 90 | MAPK12 | 0.26871546 |
| 91 | TRPM7 | 0.25850692 |
| 92 | PTK6 | 0.25546445 |
| 93 | MAP3K1 | 0.25318784 |
| 94 | ROCK1 | 0.24057987 |
| 95 | PRKCD | 0.23091999 |
| 96 | MAP3K7 | 0.22939298 |
| 97 | PDGFRB | 0.22431773 |
| 98 | LRRK2 | 0.22405016 |
| 99 | PRKCA | 0.22310809 |
| 100 | MAPK3 | 0.22087421 |

| Rank | Gene Set | Z-score |
|---|---|---|
| 1 | Primary immunodeficiency_Homo sapiens_hsa05340 | 6.02779277 |
| 2 | Graft-versus-host disease_Homo sapiens_hsa05332 | 4.02211203 |
| 3 | Autoimmune thyroid disease_Homo sapiens_hsa05320 | 3.68361465 |
| 4 | Allograft rejection_Homo sapiens_hsa05330 | 3.54729150 |
| 5 | Antigen processing and presentation_Homo sapiens_hsa04612 | 3.33730055 |
| 6 | Natural killer cell mediated cytotoxicity_Homo sapiens_hsa04650 | 3.19171796 |
| 7 | T cell receptor signaling pathway_Homo sapiens_hsa04660 | 3.16511664 |
| 8 | Hematopoietic cell lineage_Homo sapiens_hsa04640 | 2.70729445 |
| 9 | Type I diabetes mellitus_Homo sapiens_hsa04940 | 2.58884432 |
| 10 | Cytosolic DNA-sensing pathway_Homo sapiens_hsa04623 | 2.36448723 |
| 11 | NF-kappa B signaling pathway_Homo sapiens_hsa04064 | 2.18542953 |
| 12 | Inflammatory bowel disease (IBD)_Homo sapiens_hsa05321 | 2.12467804 |
| 13 | Measles_Homo sapiens_hsa05162 | 2.10700407 |
| 14 | Proteasome_Homo sapiens_hsa03050 | 2.08957781 |
| 15 | Intestinal immune network for IgA production_Homo sapiens_hsa04672 | 2.01068583 |
| 16 | Viral myocarditis_Homo sapiens_hsa05416 | 1.83711051 |
| 17 | Staphylococcus aureus infection_Homo sapiens_hsa05150 | 1.67594127 |
| 18 | Cytokine-cytokine receptor interaction_Homo sapiens_hsa04060 | 1.64574119 |
| 19 | Caffeine metabolism_Homo sapiens_hsa00232 | 1.59264694 |
| 20 | Rheumatoid arthritis_Homo sapiens_hsa05323 | 1.54494626 |
| 21 | Asthma_Homo sapiens_hsa05310 | 1.38562697 |
| 22 | Cell adhesion molecules (CAMs)_Homo sapiens_hsa04514 | 1.36232698 |
| 23 | RIG-I-like receptor signaling pathway_Homo sapiens_hsa04622 | 1.35205837 |
| 24 | Toll-like receptor signaling pathway_Homo sapiens_hsa04620 | 1.26500727 |
| 25 | Leishmaniasis_Homo sapiens_hsa05140 | 1.26325744 |
| 26 | Chagas disease (American trypanosomiasis)_Homo sapiens_hsa05142 | 1.23130842 |
| 27 | Shigellosis_Homo sapiens_hsa05131 | 1.15956346 |
| 28 | Chemokine signaling pathway_Homo sapiens_hsa04062 | 1.15948998 |
| 29 | Osteoclast differentiation_Homo sapiens_hsa04380 | 1.13967062 |
| 30 | Salmonella infection_Homo sapiens_hsa05132 | 1.13915377 |
| 31 | Malaria_Homo sapiens_hsa05144 | 1.13686338 |
| 32 | Herpes simplex infection_Homo sapiens_hsa05168 | 1.11140633 |
| 33 | NOD-like receptor signaling pathway_Homo sapiens_hsa04621 | 1.10131465 |
| 34 | Fat digestion and absorption_Homo sapiens_hsa04975 | 1.09653792 |
| 35 | Fc gamma R-mediated phagocytosis_Homo sapiens_hsa04666 | 1.05898249 |
| 36 | Retinol metabolism_Homo sapiens_hsa00830 | 1.00412163 |
| 37 | Jak-STAT signaling pathway_Homo sapiens_hsa04630 | 0.99949005 |
| 38 | Linoleic acid metabolism_Homo sapiens_hsa00591 | 0.99908225 |
| 39 | Drug metabolism - other enzymes_Homo sapiens_hsa00983 | 0.98106840 |
| 40 | Cyanoamino acid metabolism_Homo sapiens_hsa00460 | 0.93322792 |
| 41 | TNF signaling pathway_Homo sapiens_hsa04668 | 0.92535051 |
| 42 | Chemical carcinogenesis_Homo sapiens_hsa05204 | 0.87774494 |
| 43 | Drug metabolism - cytochrome P450_Homo sapiens_hsa00982 | 0.86582744 |
| 44 | alpha-Linolenic acid metabolism_Homo sapiens_hsa00592 | 0.83857529 |
| 45 | Ascorbate and aldarate metabolism_Homo sapiens_hsa00053 | 0.81182343 |
| 46 | Porphyrin and chlorophyll metabolism_Homo sapiens_hsa00860 | 0.79860240 |
| 47 | B cell receptor signaling pathway_Homo sapiens_hsa04662 | 0.79232829 |
| 48 | Pertussis_Homo sapiens_hsa05133 | 0.79210250 |
| 49 | Complement and coagulation cascades_Homo sapiens_hsa04610 | 0.78578973 |
| 50 | Influenza A_Homo sapiens_hsa05164 | 0.74937843 |
| 51 | Apoptosis_Homo sapiens_hsa04210 | 0.74488612 |
| 52 | Steroid hormone biosynthesis_Homo sapiens_hsa00140 | 0.71992774 |
| 53 | Vitamin digestion and absorption_Homo sapiens_hsa04977 | 0.70534308 |
| 54 | Metabolism of xenobiotics by cytochrome P450_Homo sapiens_hsa00980 | 0.69686631 |
| 55 | African trypanosomiasis_Homo sapiens_hsa05143 | 0.66234868 |
| 56 | Pathogenic Escherichia coli infection_Homo sapiens_hsa05130 | 0.65338702 |
| 57 | Pentose and glucuronate interconversions_Homo sapiens_hsa00040 | 0.64244526 |
| 58 | Renin-angiotensin system_Homo sapiens_hsa04614 | 0.60686981 |
| 59 | Primary bile acid biosynthesis_Homo sapiens_hsa00120 | 0.59777060 |
| 60 | Sulfur metabolism_Homo sapiens_hsa00920 | 0.58788781 |
| 61 | Phenylalanine, tyrosine and tryptophan biosynthesis_Homo sapiens_hsa00400 | 0.58397807 |
| 62 | Non-alcoholic fatty liver disease (NAFLD)_Homo sapiens_hsa04932 | 0.58109144 |
| 63 | Prion diseases_Homo sapiens_hsa05020 | 0.55680977 |
| 64 | Tuberculosis_Homo sapiens_hsa05152 | 0.54379861 |
| 65 | Legionellosis_Homo sapiens_hsa05134 | 0.51371921 |
| 66 | Toxoplasmosis_Homo sapiens_hsa05145 | 0.50950405 |
| 67 | Oxidative phosphorylation_Homo sapiens_hsa00190 | 0.50577803 |
| 68 | Epstein-Barr virus infection_Homo sapiens_hsa05169 | 0.50528621 |
| 69 | Arachidonic acid metabolism_Homo sapiens_hsa00590 | 0.48081733 |
| 70 | Peroxisome_Homo sapiens_hsa04146 | 0.47933369 |
| 71 | Systemic lupus erythematosus_Homo sapiens_hsa05322 | 0.47600492 |
| 72 | Leukocyte transendothelial migration_Homo sapiens_hsa04670 | 0.46834587 |
| 73 | HTLV-I infection_Homo sapiens_hsa05166 | 0.44798762 |
| 74 | Bacterial invasion of epithelial cells_Homo sapiens_hsa05100 | 0.44341330 |
| 75 | SNARE interactions in vesicular transport_Homo sapiens_hsa04130 | 0.44113375 |
| 76 | Parkinsons disease_Homo sapiens_hsa05012 | 0.44015054 |
| 77 | Starch and sucrose metabolism_Homo sapiens_hsa00500 | 0.37987440 |
| 78 | Mineral absorption_Homo sapiens_hsa04978 | 0.37304755 |
| 79 | Phenylalanine metabolism_Homo sapiens_hsa00360 | 0.36290461 |
| 80 | Endocytosis_Homo sapiens_hsa04144 | 0.33531865 |
| 81 | Fc epsilon RI signaling pathway_Homo sapiens_hsa04664 | 0.33104228 |
| 82 | Arginine biosynthesis_Homo sapiens_hsa00220 | 0.30537522 |
| 83 | PPAR signaling pathway_Homo sapiens_hsa03320 | 0.28748955 |
| 84 | Hepatitis C_Homo sapiens_hsa05160 | 0.28035175 |
| 85 | Adipocytokine signaling pathway_Homo sapiens_hsa04920 | 0.27914779 |
| 86 | Fatty acid degradation_Homo sapiens_hsa00071 | 0.27489477 |
| 87 | Viral carcinogenesis_Homo sapiens_hsa05203 | 0.26657995 |
| 88 | Fructose and mannose metabolism_Homo sapiens_hsa00051 | 0.23992376 |
| 89 | Tryptophan metabolism_Homo sapiens_hsa00380 | 0.23212221 |
| 90 | ABC transporters_Homo sapiens_hsa02010 | 0.21413016 |
| 91 | Histidine metabolism_Homo sapiens_hsa00340 | 0.21354895 |
| 92 | Alzheimers disease_Homo sapiens_hsa05010 | 0.20767772 |
| 93 | Glycerolipid metabolism_Homo sapiens_hsa00561 | 0.20635083 |
| 94 | Nitrogen metabolism_Homo sapiens_hsa00910 | 0.20600763 |
| 95 | Hepatitis B_Homo sapiens_hsa05161 | 0.18402584 |
| 96 | Platelet activation_Homo sapiens_hsa04611 | 0.18344838 |
| 97 | Bile secretion_Homo sapiens_hsa04976 | 0.17481829 |
| 98 | Butanoate metabolism_Homo sapiens_hsa00650 | 0.15585317 |
| 99 | Inflammatory mediator regulation of TRP channels_Homo sapiens_hsa04750 | 0.13780828 |
| 100 | Nicotinate and nicotinamide metabolism_Homo sapiens_hsa00760 | 0.12496290 |