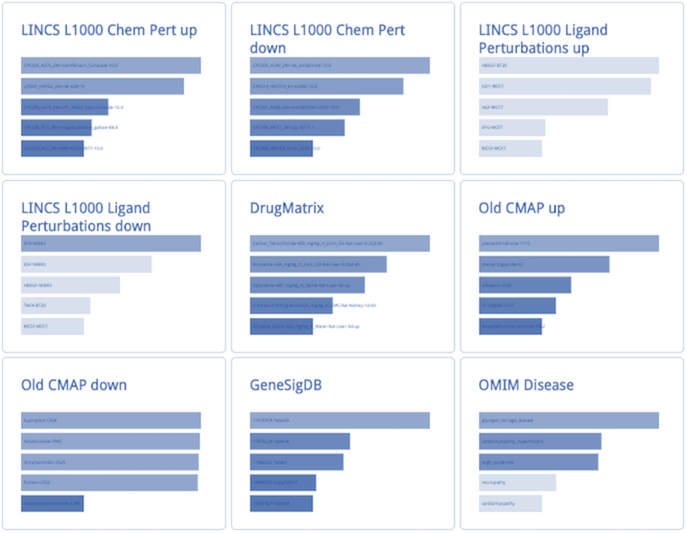
Enrichment analysis of genes downregulated in SP3 Deficiency
Canned Analysis
FAIR Metrics
0 evaluations
General Information
| Accession | DCA00067499 |
| Title | Enrichment analysis of genes downregulated in SP3 Deficiency |
| Description | An enrichment analysis was performed on the top 500 most downregulated genes identified by applying the Characteristic Direction method comparing gene expression between SP3 Deficiency cells and control cells in the Embryonic heart (day 12.5 C57Bl/6) cell type. |
| Analysis URL | http://amp.pharm.mssm.edu/Enrichr/enrich?dataset=1c0u9 |
| Upload Date | September 20, 2017 |
| Uploader | maayanlab |
Metadata
| Analysis Curator | cadimo |
| CREEDS ID | gene:637 |
| Cell Type | Embryonic heart (day 12.5 C57Bl/6) |
| Gene Symbol (human) | SP3 |
| Gene Symbol (mouse) | Sp3 |
| Organism | mouse |
| Perturbation Type | Deficiency |
| None | {u'vals': [-0.0453292510202, -0.0423567648372, 0.0413601243931, -0.0409552186474, -0.0385082422312, -0.0375784412915, -0.0368527732649, 0.0365370621547, 0.0361261933007, -0.0359494945356, -0.0358988992464, 0.0351522132859, 0.0346144120186, 0.0344866717076 |
Characteristic Direction parameters
| Gene Set | downregulated |
| Gene Set Size | 500 |
| Control Samples | GSM230957, GSM230959, GSM230960 |
| Perturbed Samples | GSM230954, GSM230955, GSM230956 |
Tools
used in the analysis
Datasets
used in the analysis
FAIR Evaluation
Sorry, you must be signed in to evaluate this object.
