BIX-02189 (BRD-K73368362)
Overview
- pert_id
- BRD-K73368362
- Name
- BIX-02189
- Synonyms
- S1531
- Collection
- BIOA
- Summary
- BIX02189 is a selective inhibitor of MEK5 with IC50 of 1.5 nM.
- MOA
- MEK inhibitor
- Target(s)
- MAP2K5, MAPK7
- Indication(s)
- Unknown
- Phase
- Preclinical
- Canonical SMILES
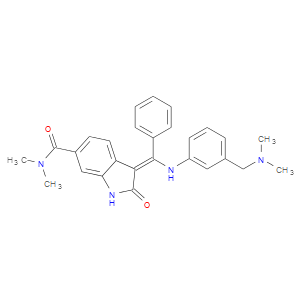
- CN(C)Cc1cccc(NC(c2ccccc2)=C2/C(=O)Nc3cc(ccc23)C(=O)N(C)C)c1
- InChI key
- InChIKey=HOMJAAIVTDVQJA-IZHYLOQSSA-N
- InChI string
- InChI=1S/C27H28N4O2/c1-30(2)17-18-9-8-12-21(15-18)28-25(19-10-6-5-7-11-19)24-22-14-13-20(27(33)31(3)4)16-23(22)29-26(24)32/h5-16,28H,17H2,1-4H3,(H,29,32)/b25-24-
- Molecular formula
- C27H28N4O2
- Molecular weight
- 440.537
External links
- PubChem
- 46931012
- Wikipedia
- http://www.selleckchem.com/products/BIX-02189.html
- SEP-L1000
- BRD-K73368362
Predicted MOAs
| MOA | Probability |
|---|---|
| RAF inhibitor | 0.5358 |
| PARP inhibitor | 0.0729 |
| EGFR inhibitor | 0.0418 |
| calcium channel blocker | 0.0324 |
| cyclooxygenase inhibitor | 0.0289 |
| CDK inhibitor | 0.0253 |
| adrenergic receptor antagonist | 0.0210 |
| tubulin polymerization inhibitor | 0.0191 |
| dopamine receptor antagonist | 0.0188 |
| MEK inhibitor | 0.0181 |
Chemical structure
Gene signatures
| Signature ID | p-value | Cell | Dose | |
|---|---|---|---|---|
| 1 | LJP007_HA1E_24H:BRD-K73368362:10 | 0.0032 | HA1E | 10.0 |
| 2 | LJP007_HCC515_24H:BRD-K73368362:10 | 0.0037 | HCC515 | 10.0 |
| 3 | LJP007_MCF7_24H:BRD-K73368362:10 | 0.009 | MCF7 | 10.0 |
| 4 | LJP007_PC3_24H:BRD-K73368362:10 | 0.0236 | PC3 | 10.0 |
| 5 | LJP007_A375_24H:BRD-K73368362:10 | 0.0244 | A375 | 10.0 |
| 6 | LJP007_HEPG2_24H:BRD-K73368362:10 | 0.0253 | HEPG2 | 10.0 |
| 7 | LJP007_HT29_24H:BRD-K73368362:10 | 0.0439 | HT29 | 10.0 |
| 8 | LJP007_HEPG2_24H:BRD-K73368362:3.33 | 0.0682 | HEPG2 | 3.3 |
| 9 | LJP007_HA1E_24H:BRD-K73368362:3.33 | 0.0831 | HA1E | 3.3 |
PCA
Interactive 3D principal component analysis of gene signatures. You can rotate the visualization and mouse over the data points.
Genes
Hierarchical clustering of genes based on weights from the differential expression method.
Enrichr
Enrichr is a web tool that performs gene set enrichment analysis. To generate the hierarchical clusterings below, GEN3VA enriched each gene signature using Enrichr and then clustered the terms. Use the select button to change Enrichr's background library.
Hierarchical clustering of enriched terms from
L1000CDS2
L1000CDS2 is a web tool that queries the LINCS L1000 dataset to identify small molecules that can reverse or mimic the observed input expression pattern. To generate the hierarchical clustering below, GEN3VA enriched each gene signature using L1000CDS2 to generate a list of perturbations that either mimic (red) and reverse (blue) expression.