Underlying Data Sets
Below we provide a short introduction about the underlying datasets used by Geneshot. These datasets are available from the download section.
Here we have a short introduction of the datasets that are being used by Geneshot. The data used by Geneshot is
GeneRIF
GeneRIF is a manually curated dataset containing associations of genes with publications. The original data can be found at
ftp://ftp.ncbi.nih.gov/gene/GeneRIF/. For Geneshot we focus on human genes. The current version of GeneRIF contains 396,020
gene-publication associations for human genes. The original GeneRIF data provides a timestamp when the association was entered
into the GeneRIF database. For Geneshot, this date was replaced with the actual publication date.
AutoRIF
Analogous to GeneRIF, we created an alternative dataset called AutoRIF. AutoRIF contains the same type of information as GeneRIF,
associations between gene and publications. AutoRIF is automatically generated, and it currently contains 4,908,396 gene-publication
associations. Hence, AutoRIF is more comprehensive than GeneRIF. We constructed AutoRIF by querying PubMed with all the human official
gene symbols and collected the PMIDs for each query. It is important to note that some gene symbol terms are ambiguous. Since these gene
symbols cannot be linked reliably linked to publications, we manually removed them from AutoRIF.
Gene-gene Co-expression Matrix from ARCHS4
Geneshot is using gene-gene co-expression data to make predictions about associations between genes and search terms. The gene-gene co-expression matrix
used by Geneshot contains pairwise correlations between all human genes. The correlations were calculated using the Spearman’s correlation
formula applied to a subset of samples from the ARCHS4 resource. The correlation is calculated over samples from a diverse set of cell types
and cell lines. Before calculating the correlation, we quantile normalize the gene expression profiles and then calculated the Spearman’s
correlation. his pairwise gene similarity matrix is used to transitively associate gene sets returned from the original Geneshot query with
their most correlated co-expressed genes.
Gene-gene Co-occurrence Matrix from Tagger
The gene-gene co-occurrence matrix Tagger data contains pairwise gene-gene similarity based on the co-occurrence of genes in publication abstracts.
The matrix contains the counts of how often two genes co-occur in the same query list.
Gene-gene Co-occurrence Matrix from Enrichr user-submitted lists
Enrichr is a leading tool for enrichment analysis. It processes thousands of queries from experiments involving gene expression analysis. Each list contains unique
information about the composition of real user queries and can shed light into gene-gene dependencies across a wide variety of experimental conditions.
Submitting Queries to Geneshot
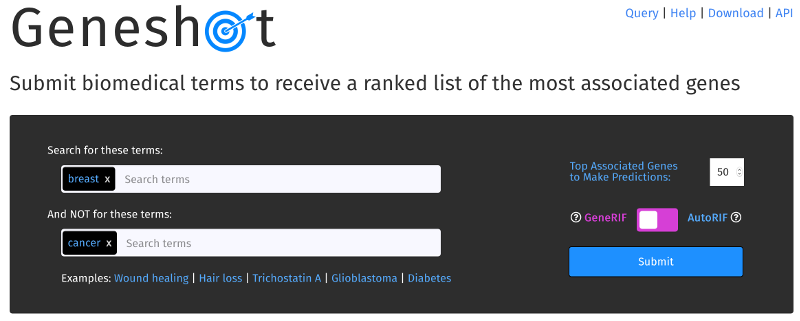
The query box of Geneshot contains two free text input fields where users can enter multiple search terms in combination. The top filed is
for terms that will be converted to associated with genes. For example, if we want to identify genes that are most relevant to the search
terms “liver fibrosis”. The bottom free text input field is for terms that the user wishes to exclude from the search. For example, if we want
o exclude all matches of “liver fibrosis” that also mention the term “cancer”.
On the right side of the search box is a switch that provides the user with a choice between querying with GeneRIF or AutoRIF.
The input field labeled "top associated genes to make predictions" sets the number of top genes from the query to use for generating the
predicted lists. This value can be changed later after the query completes.
The query time varies from instantly returned results to about 30 seconds. The time for the query to complete is mostly dependent on the
number of associated publications found for the search terms. A very general search term such as "cancer" or “diabetes” will result in a
longer wait time than a more specific search term such as "hair loss". Below the free text input fields, several sample queries are provided.
Clicking on these terms triggers a query.
Data Visualization of the Query Results
Scatterplot
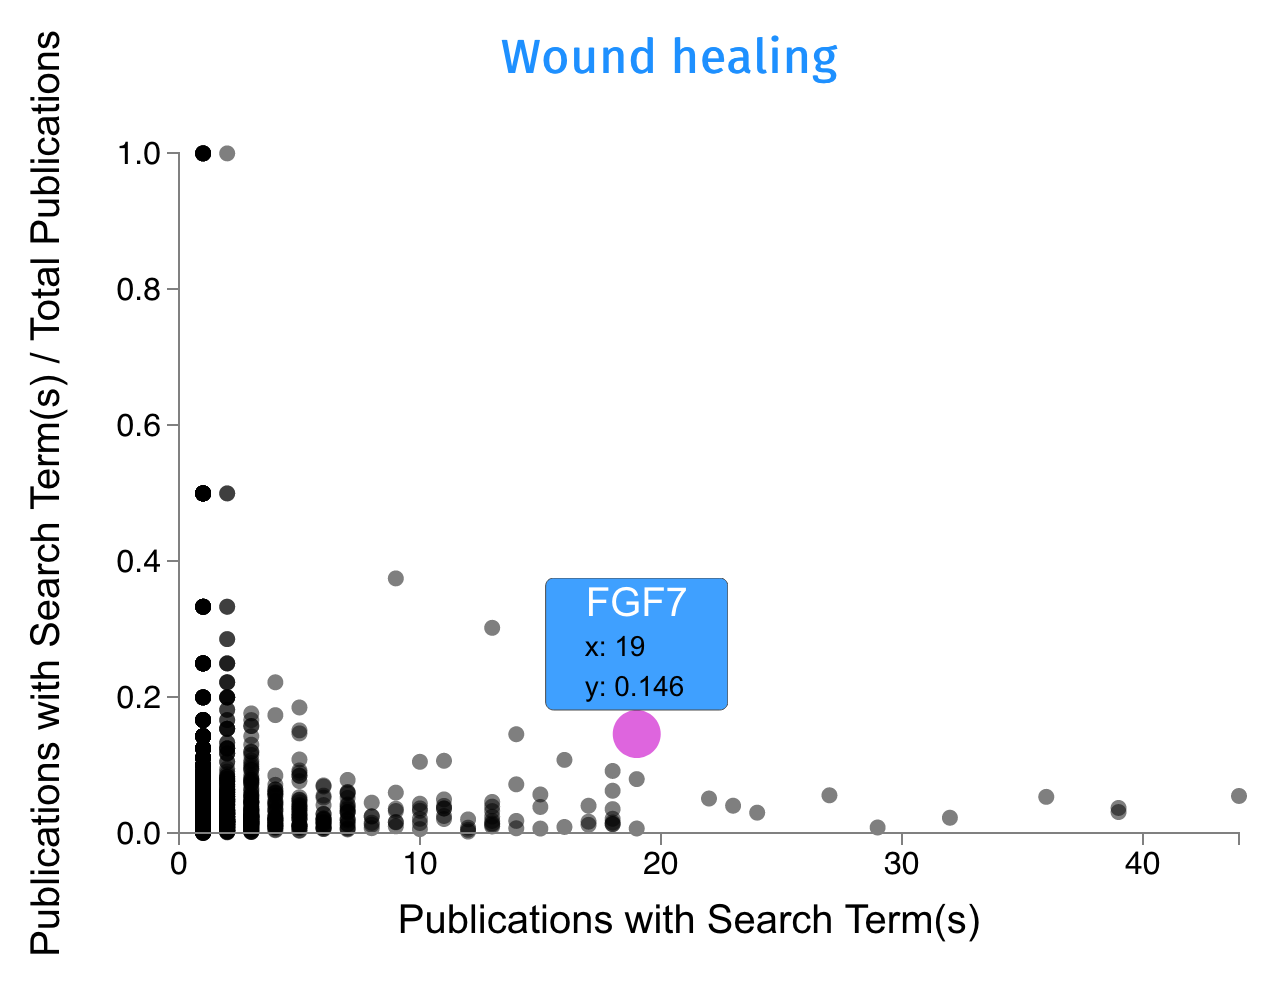
The scatterplot becomes visible once the query results are returned to the user. The plot shows the genes that are associated with the search
terms. Each point represents a gene. The x-axis is the number of publications that match the search term and the associated gene (either
by GeneRIF or AutoRIF). The y-axis displays the normalized fraction of publications relative to the total number of publications the gene is
associated with regardless of the search term. For instance, the gene FGF7 is associated with 19 publications that are also matching the search
term "wound healing" (x-axis). The normalized fraction (y-axis) is 0.146. This means that from all the publications that mention FGF7, 14.6% of
them also mention "wound healing".
Histogram
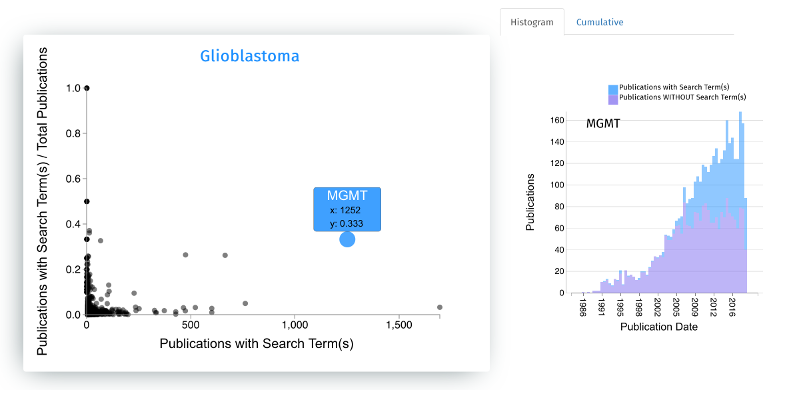
When a gene in the scatterplot is selected by clicking on it, additional information about the gene is retrieved from our server. On the right of
the scatterplot, a histogram is displaying the association of the gene with the search terms over time. The number of publications for the selected
gene that do not match the search term is displayed as pink bars, while the number of publications matching the search term and the gene is displayed
as blue bars. In the example below, we can see that the gene MGMT was not associated with Glioblastoma until around 2005. In the year 2017, about 50%
of the publications that mentioned MGMT also mentioned Glioblastoma. This plot helps in identifying association trends for genes and terms over time.
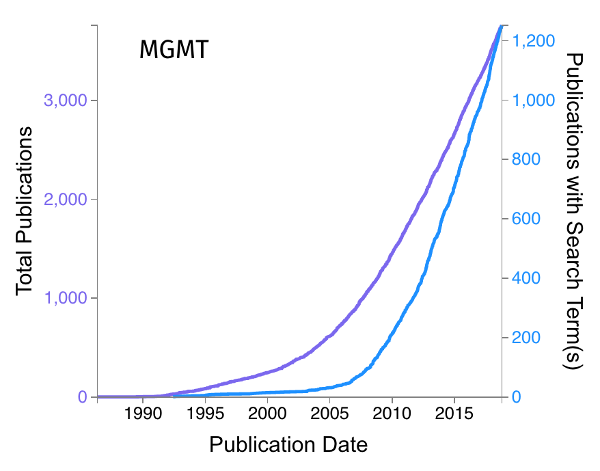
Cumulative Distribution Plot
This plot contains the same information as the histogram, but it visualizes the data differently. The axis is the total number of publications and the publications that match the search term.
Result Tables

Associated Gene Table
The associated gene table contains the same information that is displayed in the scatter plot. The table will appear once the query results are
returned. The number of genes returned by the query can vary, depending on how many genes are associated with the search terms. On top of
the table, there are six buttons labeled: “Kinases”, “Dark kinases”, “GCPRs”, “Dark GCPRs”, “Ion channels”, and “Dark ion channels”. These
buttons serve as filters. When clicked, the table displays only the genes that belong in the respective gene family category. A gene is
considered dark based on its inclusion in lists published by the NIH for the Illuminating the Druggable Genome (IDG) NIH Commons Fund program.
These lists are taken from the IDG Knowledge Management Center (KMC) RFA https://grants.nih.gov/grants/guide/rfa-files/RFA-RM-16-024.html.The
slider above the table enables users to set the threshold for how many genes to include for predicting additional genes. In this example, the
top 50 associated genes are used to perform the prediction.
Predicted Gene Tables
Predicting additional genes that should be associated with the search terms is performed using the gene-gene co-expression matrix from ARCHS4
and the gene-gene co-occurrence matrix from Tagger. The results table can be viewed by selecting the corresponding tab. The prediction
tables list the top 200 genes most associated with the gene sets from the associated genes table on the left. When hovering over the score of
a gene, a popup will show the top 10 genes that caused it to be predicted to be associated with the search term.
The data from both tables can be downloaded in a variety of formats. The gene set within each table can be directly submitted to Enrichr for further analysis.
Gene Function Prediction
The gene-gene similarity matrices can be used to predict novel gene functions. On the gene function page a gene symbol can be entered into the search field.
Geneshot includes a set of gene set libraries. By using functional prediction by association the input gene can be predicted to be a member of gene sets. In gene set
libraries each gene set represents a group of genes that share a common property, such as a membership in a biological pathway. The performance of the prediction
varies from gene and similarity matrix selected. Literature based methods such as Tagger and AutoRIF are capable in retrieving known associations well. But they are
also able to identify novel insights. Data driven approaches such as gene co-expression perform well in retrieving existing knowledge at the same time as being unbiased
from prior knowledge. The query returns a table with ranked gene sets. If the gene was known to be a member of the gene set the row will be blue. As an internal benchmark
Geneshot displays a ROC curve to show where the true positive gene sets fell in the prediction ranking. This plot can only be generated when there is sufficient prior
knowledge about the gene of interest.
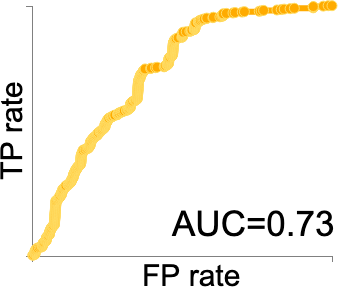
AUC plot
The AUC plot shows all gene sets ordered by similarity score to a given gene. If a gene is peviously annotated with properties from the gene set library the prediction is considered a true positive.
Ideally all previously known gene sets of which a gene is a member should be recovered in the prediction step. The quality of the retrieval can be expressed by the AUC. High AUCs can suggest that the co-expression or
co-occurrence is a good metric to infer the biological properties of the gene. If there are no prior annotations of the gene in the geneset no AUC can be computed. Generally, literature based similarity matrices perform
well here since they encode the known memberships directly. More datadriven similarity matrices such as gene co-expression are less biased to priviously known gene properties, but have to retrieve
known properties denovo. Hovering with the mouse over the AUC plot will show the property names.
Gene Set Augmentation
The gene set augmentation page lets users upload a set of genes. Geneshot can compute the group similarity of the gene set to all genes in the given gene similarity matrix.
Gene shot will identify the top 200 genes that ranked by their similarity score. In the case of the gene correlation matrix the average correlation to the input genes is calculated.
In the case of co-occurrence matrices the average sum of log2 transformed similarity scores is computed. The values in the co-occurrence matrix are the odds ratio of observed and expected
overlap for two genes. These values can be very large. As such a single pair of genes could dominat the final average similarity score. By log transforming the values first a gene set
member candidate must be similar to multiple elements in the user provided gene set.
The novelty of genes is also reported here by returning the number of publications per gene. A representation of the distribution of novelty is displayed in a barplot. Genes are grouped into four quantiles of novelty based on the
publication count of genes in AutoRIF. A gene is rare if it has 7 or fewer publications. An gene is uncommon when it has between 8 and 25 publications. Common genes have 26 to 87 publications. All genes with at least 88 publications are considered very common.
These bins divide the genes into equisized bins.

Please acknowledge Geneshot in your publications by citing the following reference:
The Geneshot source code is available from GitHub under the Apache License 2.0. Commercial users should contact Mount Sinai Innovation Partners at MSIPInfo@mssm.edu for licensing.
Geneshot is not to be used for treating or diagnosing human subjects. Geneshot or any documents available from this server are provided as is
without any warranty of any kind, either express, implied, or statutory, including, but not limited to, any implied warranties of merchantability,
fitness for particular purpose and freedom from infringement, or that Geneshot or any documents available from this server will be error free.
The Ma'ayan Laboratory makes no representations that the use of Geneshot or any documents available from this server will not infringe any patent or
proprietary rights of third parties. In no event will the Ma'ayan Laboratory or any of its members be liable for any damages, including but not limited
to direct, indirect, special or consequential damages, arising out of, resulting from, or in any way connected with the use of Geneshot or documents
available from this server.
 t