 Kinase Enrichment Analysis version 3
Kinase Enrichment Analysis 3 (KEA3) infers upstream kinases whose putative substrates are overrepresented in a user-inputted list of proteins or differentially phosphorylated proteins.
Tutorial
Navigating Your Results
Once an input list is submitted for analysis with KEA3, various results tabs will appear, each of which provides a different view of the kinase enrichment analysis results. The first tab provides integrative results; it is recommended to consider the results from this tab first.
The Integrated Results Tab
The integrated results tab displays visualizations and tables for the results from the two integrated methods, MeanRank and TopRank. The bar charts show the top 10 ranked kinases computed using each of the two methods. Each bar in the MeanRank bar chart is color-coded by library; hover over a colored segment to see the kinase rank for that library. The TopRank bar chart displays the corresponding score for each kinase. Use the sliders to view more or less kinases. The charts can be downloaded in SVG or PNG format.

Below the bar charts are tables that provide more detailed results. Kinases which are top-ranked for both integrated ranking methods have an asterisk next to their name; the default setting highlights only kinases that appear in the top 10 for both MeanRank and TopRank methods. Kinase names are linked to their corresponding Harmonizome page. In either table, kinases can be searched by name. Click on the overlapping protein counts to see the actual names of the overlapping proteins. Click on the MeanRank score to show the rank of a given kinase in each of the KEA3 libraries. Click on the Integrated Scaled Rank score to show the library with the best scaled rank of the given kinase.

Below the tables are subnetworks that connect the top-ranked kinases from the MeanRank and TopRank methods based on known kinase-substrate and kinase-protein interactions. Sliders are provided to adjust the number of kinases to include within each subnetwork. The subnetworks can be downloaded in SVG and PNG formats. Hover over an edge to view libraries in which evidence for an interaction was found.

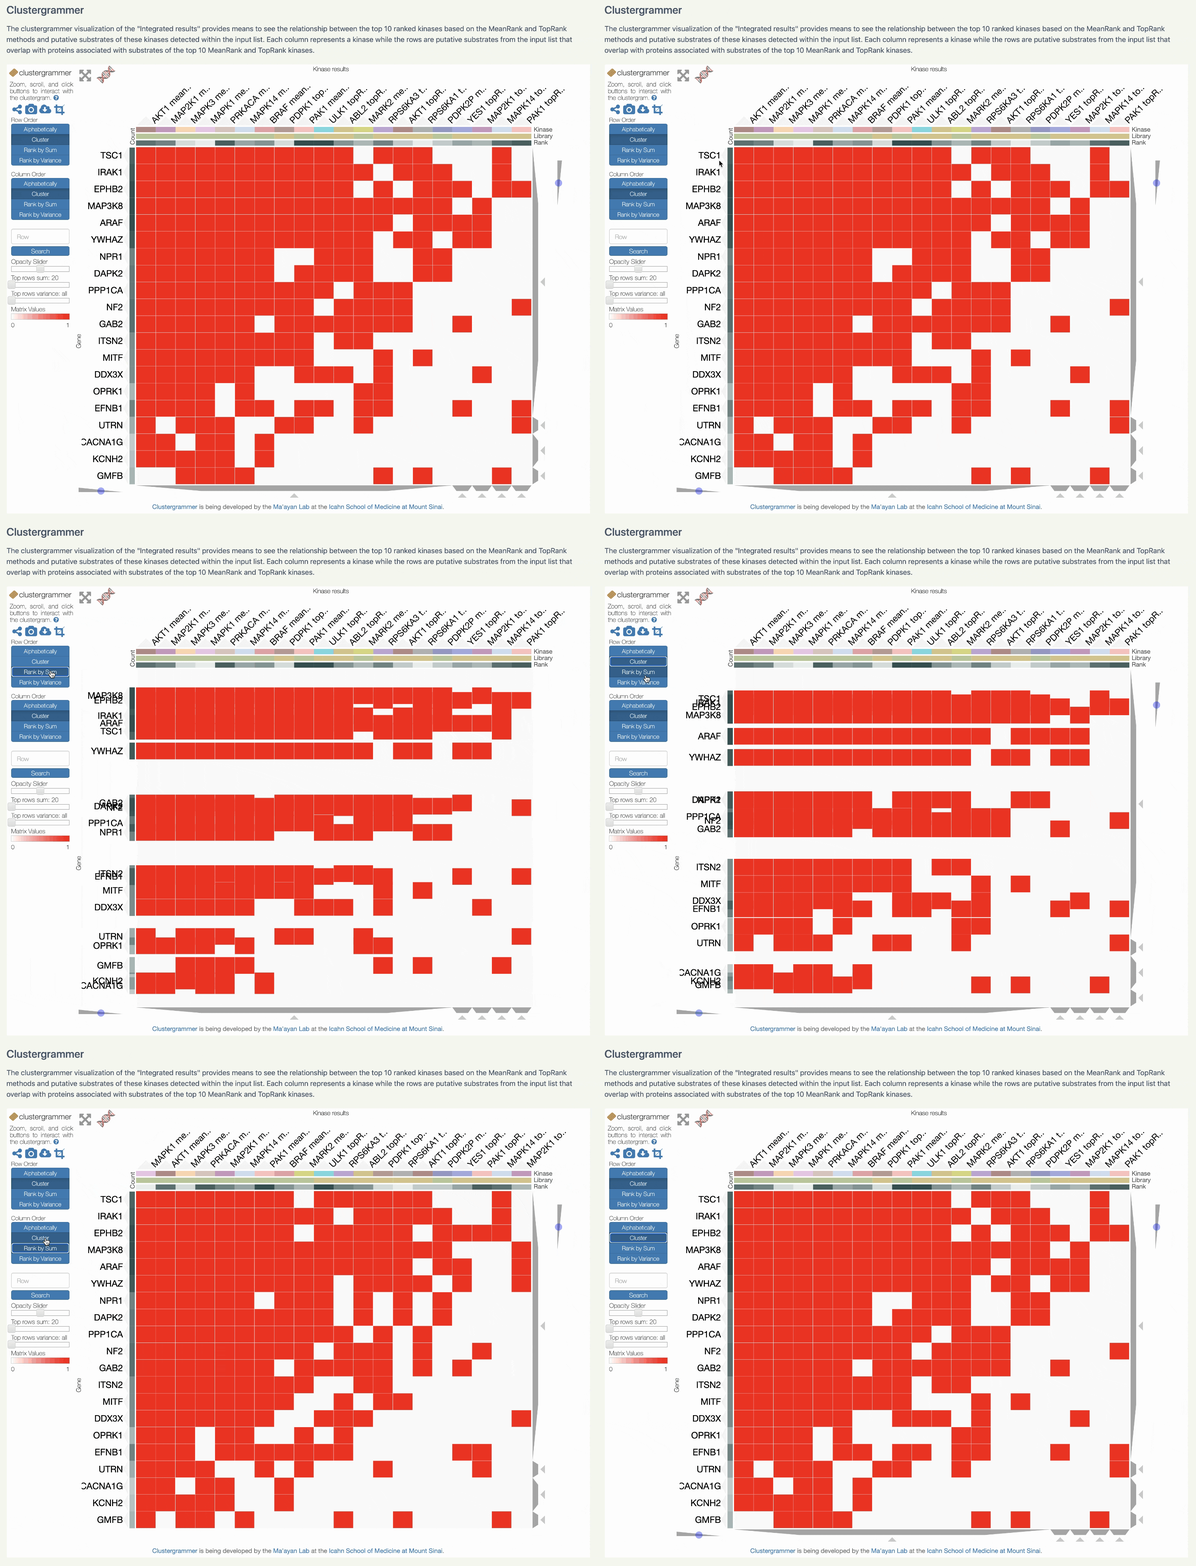
A Clustergrammer visualization is also provided for the integrated results. Each column is a ranked set from the MeanRank or TopRank results, and each row is a putative substrate from the input list that overlaps with the sets from the integrated methods. The heat map is fully interactive; hover over terms or sections for more detailed information. Rows and columns can also be sorted by sum. Clustergrammer is developed by the Ma'ayan Lab.
The Tables Tab
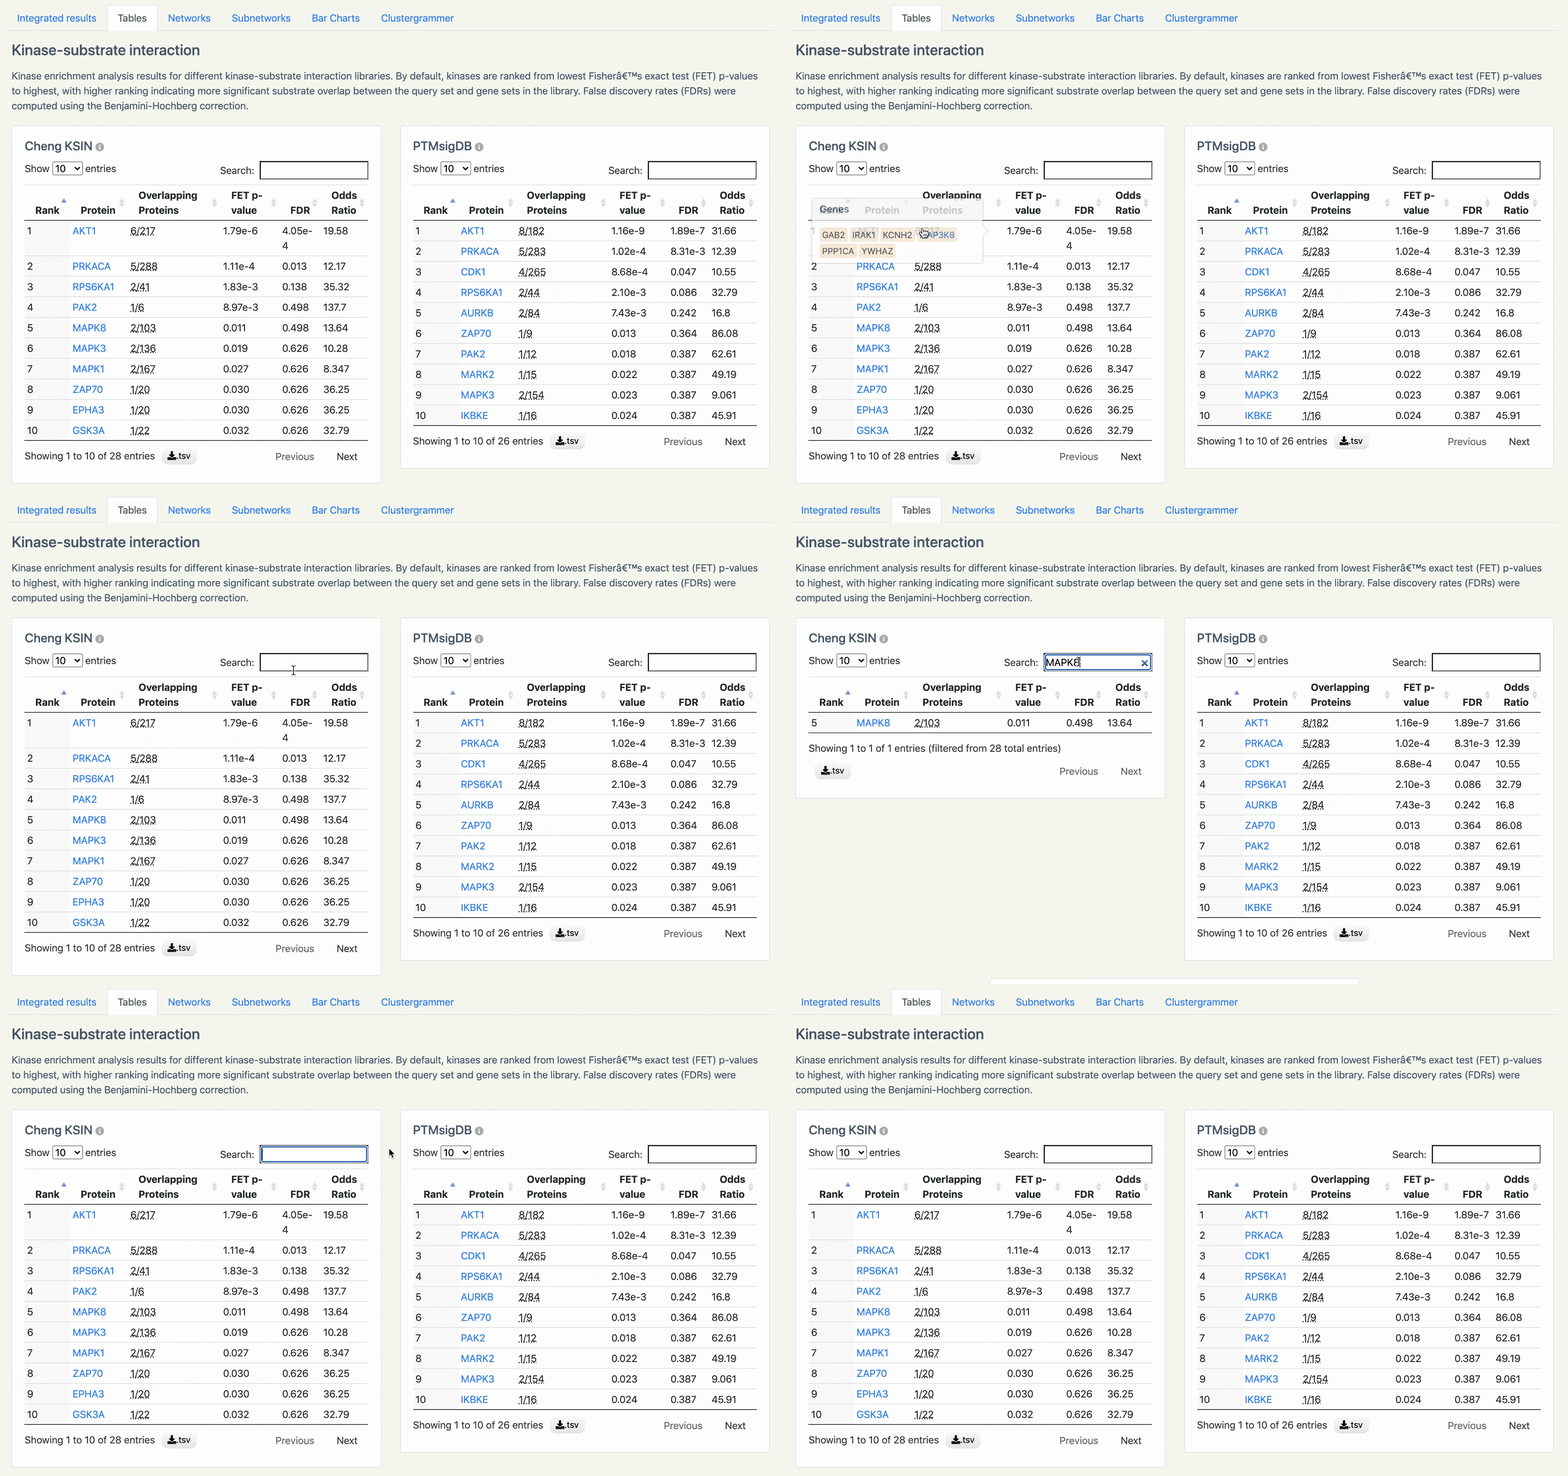
The KEA3 enrichment analysis results for different kinase-substrate interaction libraries are displayed in a table format. By default, kinases are ranked by the Fisher's Exact Test (FET) p-value in ascending order. A low p-value and high rank indicates significant enrichment for kinase substrate overlap between the query set and a gene set in the library. False discovery rates (FDRs) were computed with the Benjamini-Hochberg correction method. The table is searchable, and the name of each protein is hyperlinked to the corresponding Harmonizome page. Clicking on the overlapping protein counts will display the names of overlapping proteins. Tables may be downloaded in TSV format.
Visualizing Your Results
A global kinase co-expression network, a local results-specific co-regulatory network, bar charts, and a clustergram are available to aid in interpreting the results.
The Networks Tab
The KEA3 results are projected onto human kinome networks produced by applying Weighted Gene Co-expression Network Analysis (WGCNA) to datasets from ARCHS4, GTEx, and TCGA. Select a library using the drop-down menu above each network to view the top kinases, which will be highlighted in the visualization. By default, the top 10 kinases from the chosen library are highlighted, but this number can be adjusted using the slider above each graph. The networks can be downloaded in SVG or PNG format.

The Subnetworks Tab
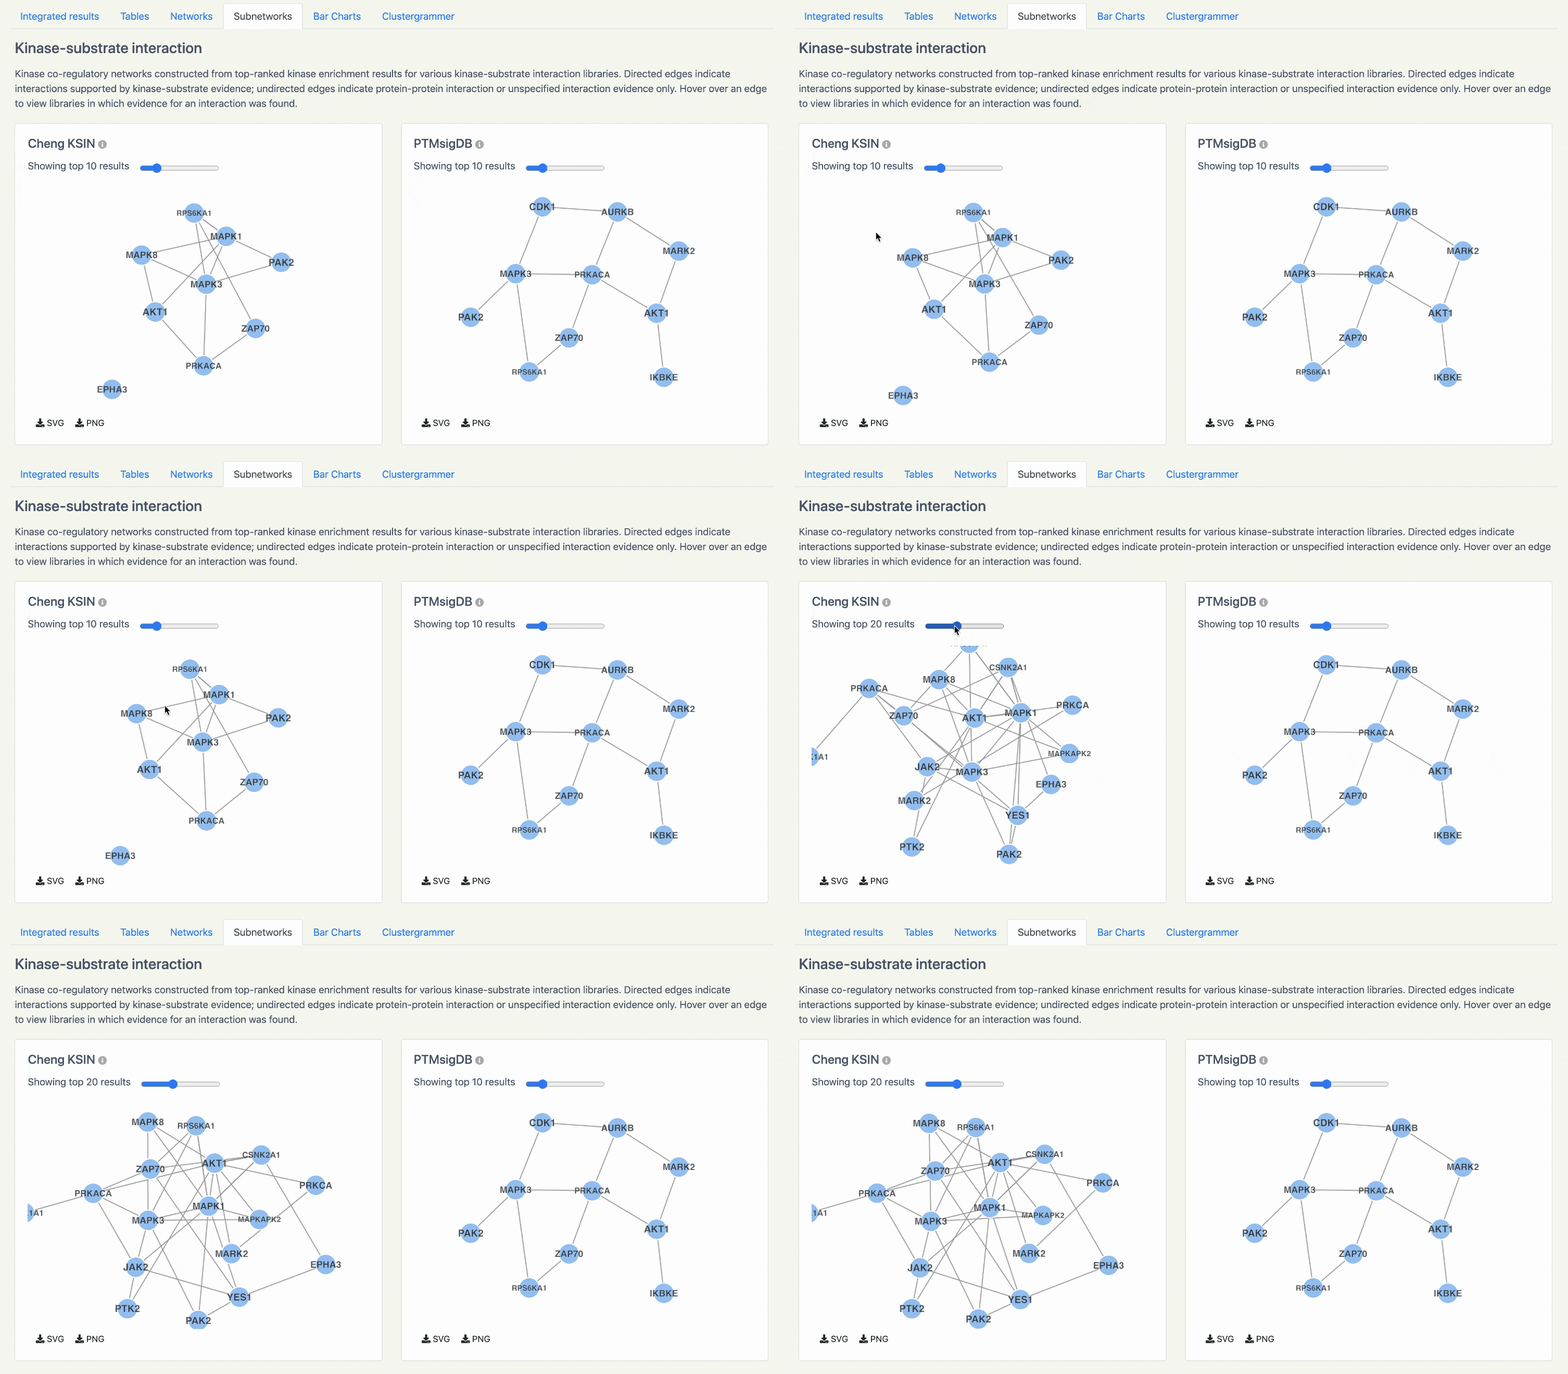
Kinase-kinase co-regulatory subnetworks are constructed by connecting the top-ranked kinases from the KEA3 results for various kinase-substrate interaction libraries. Directed edges indicate interactions supported by kinase-substrate evidence, while undirected edges indicate protein-protein interactions. Hover over an edge to view the source libraries supplying evidence for the interaction. Use the sliders to increase or decrease the number of kinases within each subnetwork.
The Bar Charts Tab
The bar charts tab provides the KEA3 results as bar charts showing the -log(p-value) of the top-ranked kinases from analysis of each KEA3 library. The numer of top kinases displayed may be modifed using the slider above each chart.
The Clustergrammer Tab
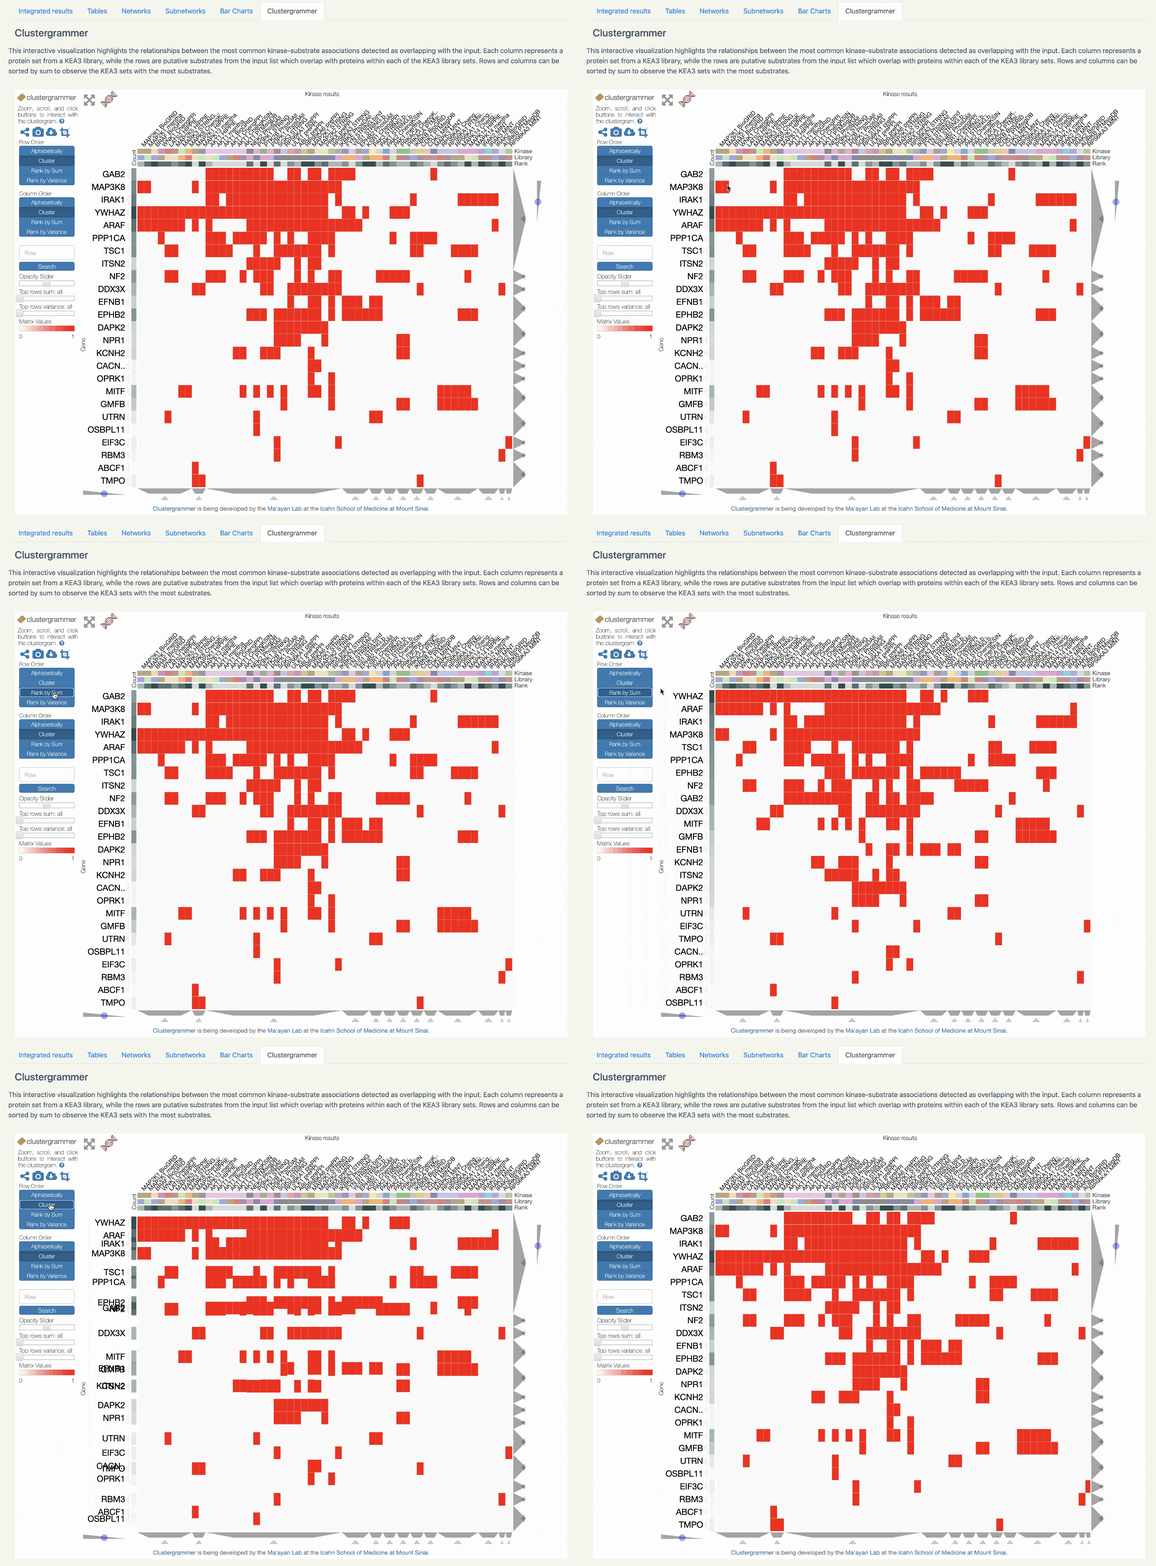
The clustergrammer tab provides a visualization of the relationships between the most common kinase-substrate associations detected as overlapping with the input. Each column represents a protein set from a KEA3 library, while the rows are putative substrates from the input list which overlap with proteins from the KEA3 library sets. Rows and columns can be sorted by sum, in order to observe the KEA3 sets with the most substrates. Clustergrammer is an interactive heatmap visualization component developed by the Ma'ayan Lab.
Accessing the KEA3 API
KEA3 provides a well-documented API to enable programmatic access for querying the KEA3 database. The KEA3 REST API uses POST to handle user-submitted JSON-formatted gene sets, and produces JSON-formatted query results. More details can be found on the API page.